Sioux vs Immigrants from Hungary Female Poverty
COMPARE
Sioux
Immigrants from Hungary
Female Poverty
Female Poverty Comparison
Sioux
Immigrants from Hungary
20.9%
FEMALE POVERTY
0.0/ 100
METRIC RATING
338th/ 347
METRIC RANK
12.7%
FEMALE POVERTY
90.3/ 100
METRIC RATING
121st/ 347
METRIC RANK
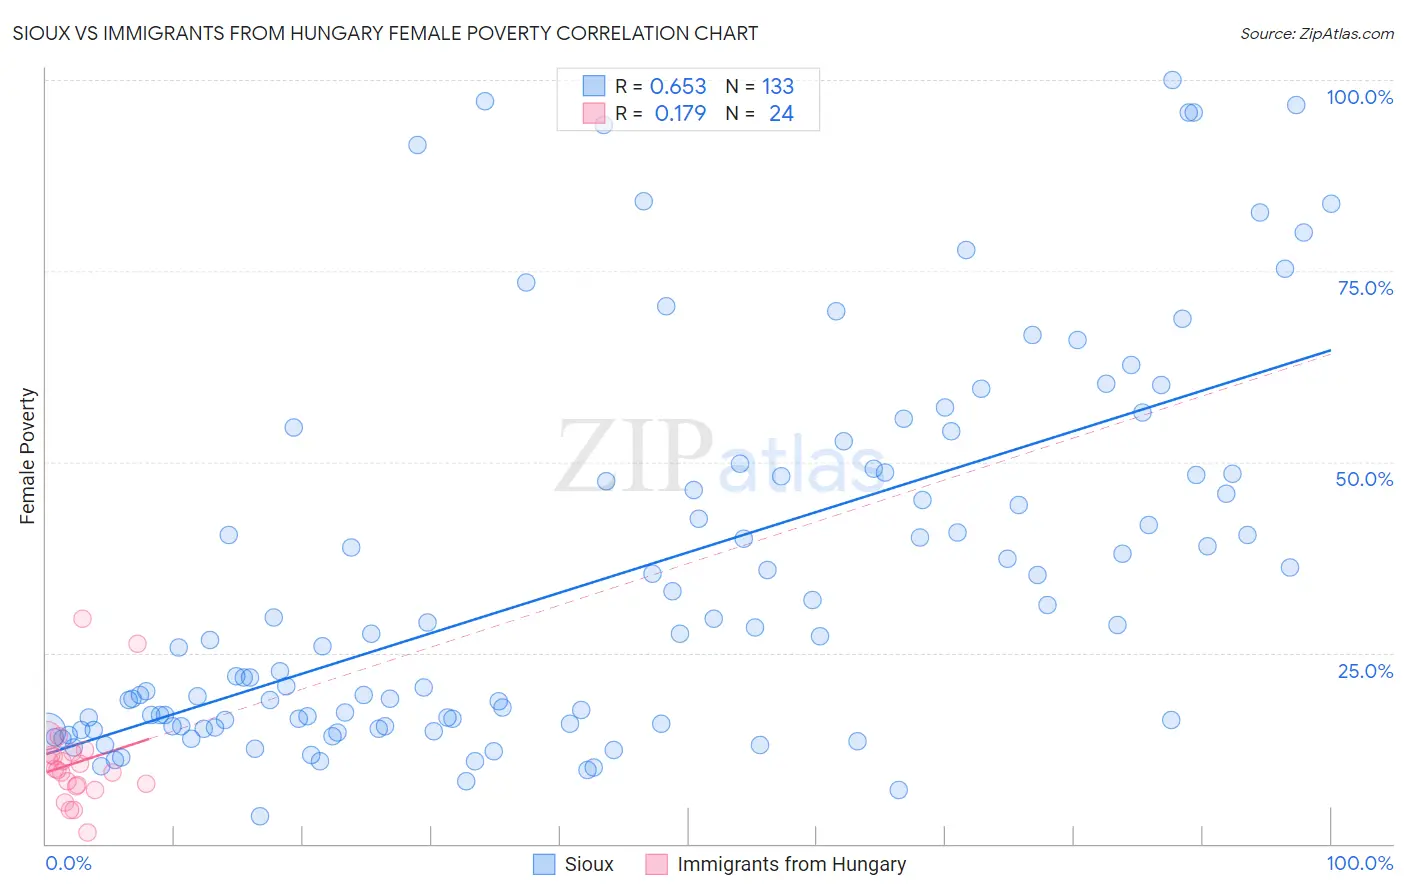
Sioux vs Immigrants from Hungary Female Poverty Correlation Chart
The statistical analysis conducted on geographies consisting of 234,087,584 people shows a significant positive correlation between the proportion of Sioux and poverty level among females in the United States with a correlation coefficient (R) of 0.653 and weighted average of 20.9%. Similarly, the statistical analysis conducted on geographies consisting of 195,645,999 people shows a poor positive correlation between the proportion of Immigrants from Hungary and poverty level among females in the United States with a correlation coefficient (R) of 0.179 and weighted average of 12.7%, a difference of 64.2%.
Female Poverty Correlation Summary
| Measurement | Sioux | Immigrants from Hungary |
| Minimum | 3.5% | 1.5% |
| Maximum | 100.0% | 29.4% |
| Range | 96.5% | 27.9% |
| Mean | 34.8% | 10.6% |
| Median | 26.7% | 9.8% |
| Interquartile 25% (IQ1) | 15.4% | 7.6% |
| Interquartile 75% (IQ3) | 48.4% | 11.8% |
| Interquartile Range (IQR) | 33.0% | 4.2% |
| Standard Deviation (Sample) | 24.5% | 6.1% |
| Standard Deviation (Population) | 24.4% | 6.0% |
Similar Demographics by Female Poverty
Demographics Similar to Sioux by Female Poverty
In terms of female poverty, the demographic groups most similar to Sioux are Yuman (20.8%, a difference of 0.19%), Hopi (21.0%, a difference of 0.37%), Pueblo (20.7%, a difference of 1.0%), Yup'ik (21.5%, a difference of 2.9%), and Cheyenne (20.2%, a difference of 3.4%).
| Demographics | Rating | Rank | Female Poverty |
| Natives/Alaskans | 0.0 /100 | #331 | Tragic 19.2% |
| Apache | 0.0 /100 | #332 | Tragic 19.2% |
| Immigrants | Dominican Republic | 0.0 /100 | #333 | Tragic 19.3% |
| Houma | 0.0 /100 | #334 | Tragic 20.0% |
| Cheyenne | 0.0 /100 | #335 | Tragic 20.2% |
| Pueblo | 0.0 /100 | #336 | Tragic 20.7% |
| Yuman | 0.0 /100 | #337 | Tragic 20.8% |
| Sioux | 0.0 /100 | #338 | Tragic 20.9% |
| Hopi | 0.0 /100 | #339 | Tragic 21.0% |
| Yup'ik | 0.0 /100 | #340 | Tragic 21.5% |
| Crow | 0.0 /100 | #341 | Tragic 22.1% |
| Immigrants | Yemen | 0.0 /100 | #342 | Tragic 22.8% |
| Lumbee | 0.0 /100 | #343 | Tragic 23.5% |
| Pima | 0.0 /100 | #344 | Tragic 23.6% |
| Navajo | 0.0 /100 | #345 | Tragic 23.9% |
Demographics Similar to Immigrants from Hungary by Female Poverty
In terms of female poverty, the demographic groups most similar to Immigrants from Hungary are French Canadian (12.7%, a difference of 0.040%), New Zealander (12.7%, a difference of 0.10%), Immigrants from South Eastern Asia (12.7%, a difference of 0.10%), Albanian (12.7%, a difference of 0.16%), and Sri Lankan (12.7%, a difference of 0.17%).
| Demographics | Rating | Rank | Female Poverty |
| Welsh | 91.6 /100 | #114 | Exceptional 12.7% |
| Puget Sound Salish | 91.5 /100 | #115 | Exceptional 12.7% |
| Immigrants | Russia | 91.2 /100 | #116 | Exceptional 12.7% |
| Immigrants | Southern Europe | 90.9 /100 | #117 | Exceptional 12.7% |
| Sri Lankans | 90.9 /100 | #118 | Exceptional 12.7% |
| Albanians | 90.8 /100 | #119 | Exceptional 12.7% |
| New Zealanders | 90.6 /100 | #120 | Exceptional 12.7% |
| Immigrants | Hungary | 90.3 /100 | #121 | Exceptional 12.7% |
| French Canadians | 90.2 /100 | #122 | Exceptional 12.7% |
| Immigrants | South Eastern Asia | 89.9 /100 | #123 | Excellent 12.7% |
| Immigrants | Norway | 89.3 /100 | #124 | Excellent 12.8% |
| Argentineans | 89.1 /100 | #125 | Excellent 12.8% |
| Immigrants | Ukraine | 88.8 /100 | #126 | Excellent 12.8% |
| South Africans | 88.4 /100 | #127 | Excellent 12.8% |
| Immigrants | Belarus | 88.2 /100 | #128 | Excellent 12.8% |