Basque vs Immigrants from Hungary Female Poverty
COMPARE
Basque
Immigrants from Hungary
Female Poverty
Female Poverty Comparison
Basques
Immigrants from Hungary
12.9%
FEMALE POVERTY
83.1/ 100
METRIC RATING
139th/ 347
METRIC RANK
12.7%
FEMALE POVERTY
90.3/ 100
METRIC RATING
121st/ 347
METRIC RANK
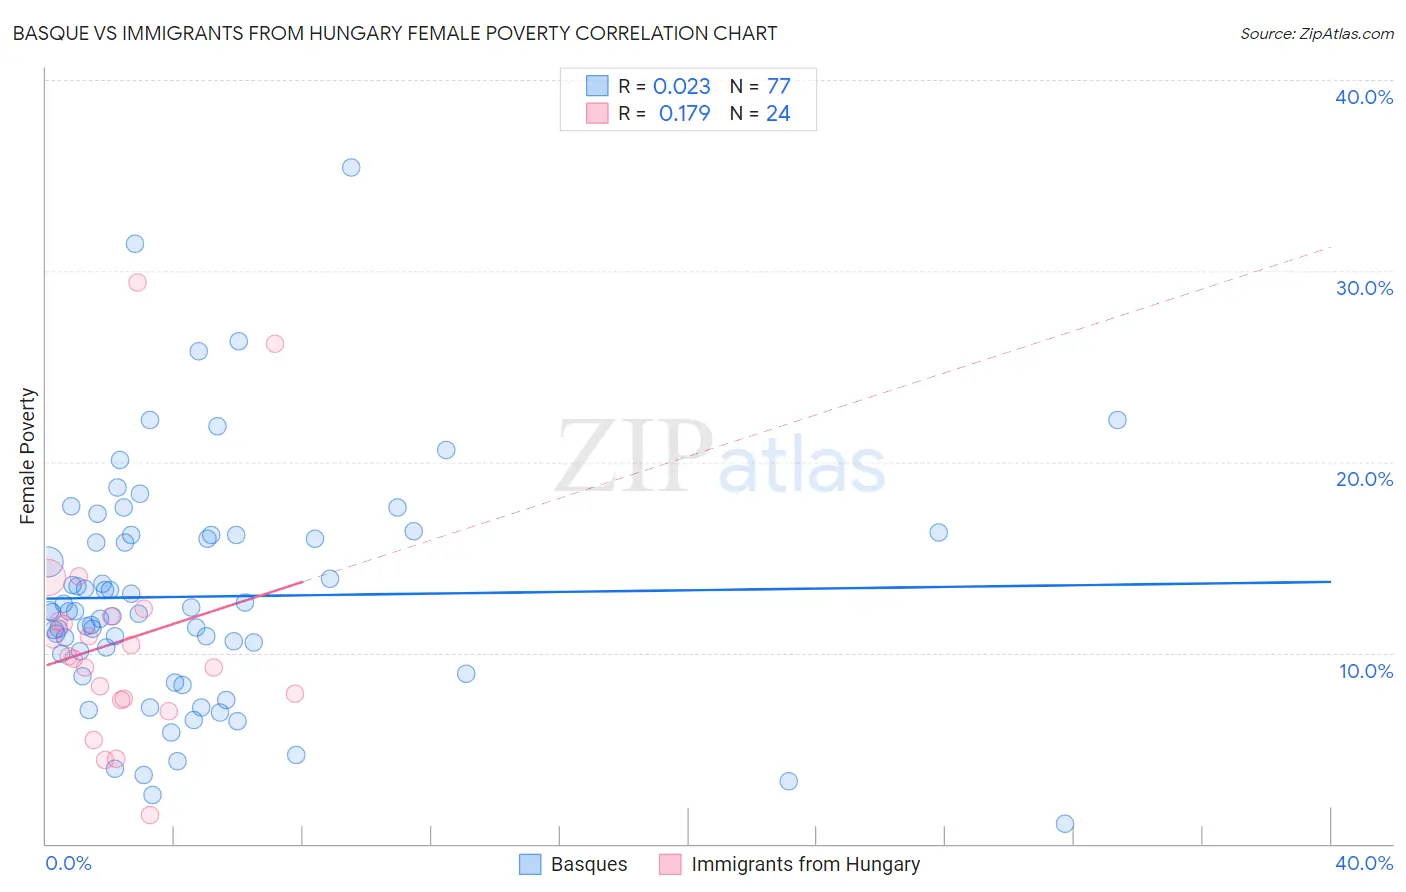
Basque vs Immigrants from Hungary Female Poverty Correlation Chart
The statistical analysis conducted on geographies consisting of 165,726,735 people shows no correlation between the proportion of Basques and poverty level among females in the United States with a correlation coefficient (R) of 0.023 and weighted average of 12.9%. Similarly, the statistical analysis conducted on geographies consisting of 195,645,999 people shows a poor positive correlation between the proportion of Immigrants from Hungary and poverty level among females in the United States with a correlation coefficient (R) of 0.179 and weighted average of 12.7%, a difference of 1.6%.
Female Poverty Correlation Summary
| Measurement | Basque | Immigrants from Hungary |
| Minimum | 1.1% | 1.5% |
| Maximum | 35.4% | 29.4% |
| Range | 34.4% | 27.9% |
| Mean | 12.9% | 10.6% |
| Median | 12.2% | 9.8% |
| Interquartile 25% (IQ1) | 9.4% | 7.6% |
| Interquartile 75% (IQ3) | 16.2% | 11.8% |
| Interquartile Range (IQR) | 6.7% | 4.2% |
| Standard Deviation (Sample) | 6.2% | 6.1% |
| Standard Deviation (Population) | 6.1% | 6.0% |
Demographics Similar to Basques and Immigrants from Hungary by Female Poverty
In terms of female poverty, the demographic groups most similar to Basques are Pakistani (12.9%, a difference of 0.010%), Immigrants from France (12.9%, a difference of 0.090%), Chilean (12.9%, a difference of 0.31%), Peruvian (12.9%, a difference of 0.40%), and French (12.9%, a difference of 0.48%). Similarly, the demographic groups most similar to Immigrants from Hungary are French Canadian (12.7%, a difference of 0.040%), New Zealander (12.7%, a difference of 0.10%), Immigrants from South Eastern Asia (12.7%, a difference of 0.10%), Immigrants from Norway (12.8%, a difference of 0.28%), and Argentinean (12.8%, a difference of 0.33%).
| Demographics | Rating | Rank | Female Poverty |
| New Zealanders | 90.6 /100 | #120 | Exceptional 12.7% |
| Immigrants | Hungary | 90.3 /100 | #121 | Exceptional 12.7% |
| French Canadians | 90.2 /100 | #122 | Exceptional 12.7% |
| Immigrants | South Eastern Asia | 89.9 /100 | #123 | Excellent 12.7% |
| Immigrants | Norway | 89.3 /100 | #124 | Excellent 12.8% |
| Argentineans | 89.1 /100 | #125 | Excellent 12.8% |
| Immigrants | Ukraine | 88.8 /100 | #126 | Excellent 12.8% |
| South Africans | 88.4 /100 | #127 | Excellent 12.8% |
| Immigrants | Belarus | 88.2 /100 | #128 | Excellent 12.8% |
| Immigrants | Brazil | 87.9 /100 | #129 | Excellent 12.8% |
| Immigrants | Vietnam | 87.1 /100 | #130 | Excellent 12.8% |
| Immigrants | Argentina | 87.0 /100 | #131 | Excellent 12.8% |
| Immigrants | Jordan | 86.9 /100 | #132 | Excellent 12.8% |
| Immigrants | Western Europe | 86.6 /100 | #133 | Excellent 12.8% |
| Immigrants | Switzerland | 85.8 /100 | #134 | Excellent 12.9% |
| French | 85.6 /100 | #135 | Excellent 12.9% |
| Peruvians | 85.2 /100 | #136 | Excellent 12.9% |
| Chileans | 84.7 /100 | #137 | Excellent 12.9% |
| Immigrants | France | 83.6 /100 | #138 | Excellent 12.9% |
| Basques | 83.1 /100 | #139 | Excellent 12.9% |
| Pakistanis | 83.0 /100 | #140 | Excellent 12.9% |