Lithuanian vs Immigrants from Hungary Female Poverty
COMPARE
Lithuanian
Immigrants from Hungary
Female Poverty
Female Poverty Comparison
Lithuanians
Immigrants from Hungary
11.4%
FEMALE POVERTY
99.8/ 100
METRIC RATING
14th/ 347
METRIC RANK
12.7%
FEMALE POVERTY
90.3/ 100
METRIC RATING
121st/ 347
METRIC RANK
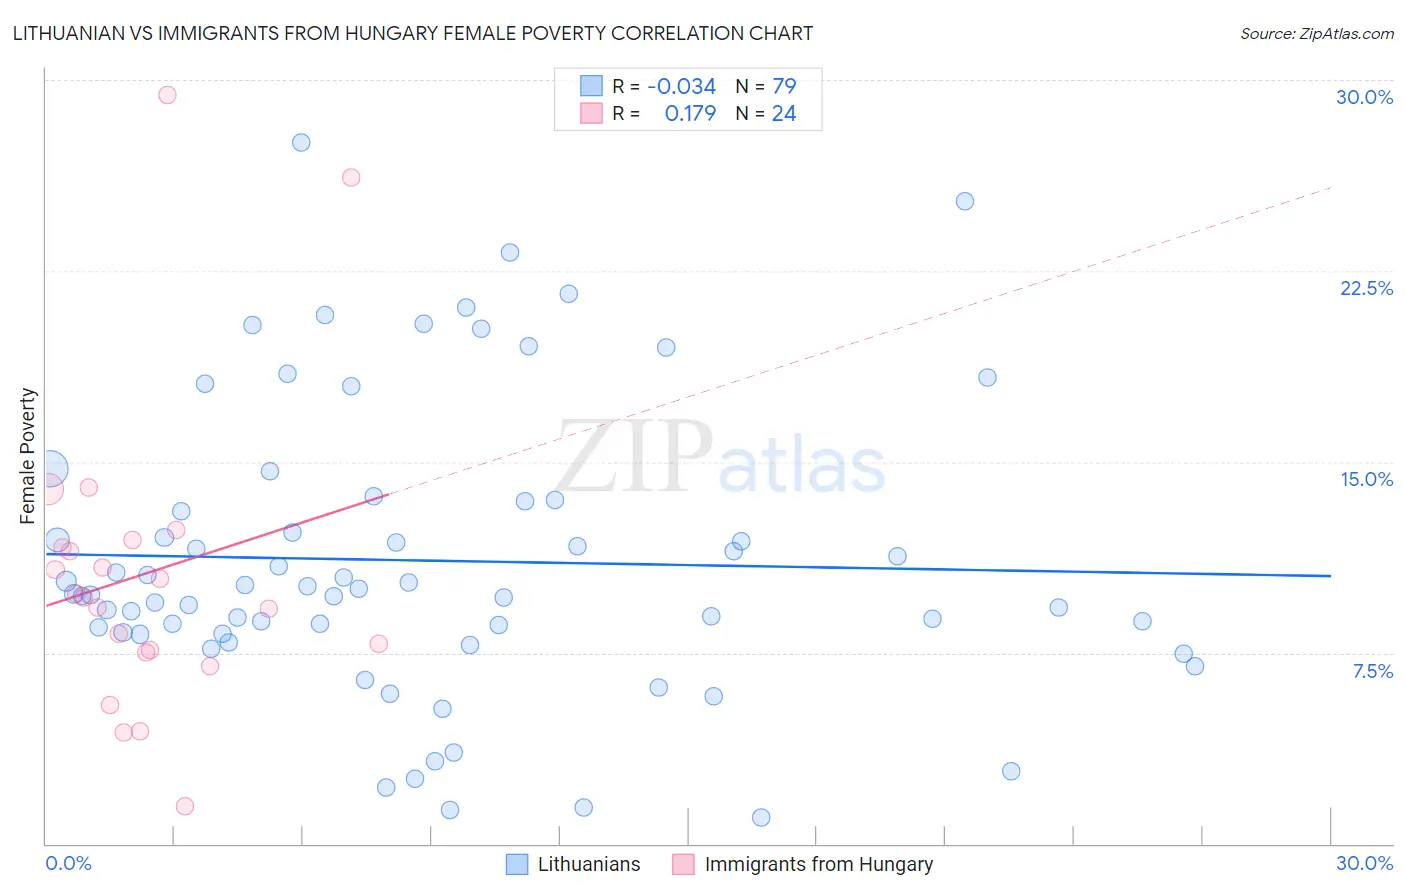
Lithuanian vs Immigrants from Hungary Female Poverty Correlation Chart
The statistical analysis conducted on geographies consisting of 421,598,229 people shows no correlation between the proportion of Lithuanians and poverty level among females in the United States with a correlation coefficient (R) of -0.034 and weighted average of 11.4%. Similarly, the statistical analysis conducted on geographies consisting of 195,645,999 people shows a poor positive correlation between the proportion of Immigrants from Hungary and poverty level among females in the United States with a correlation coefficient (R) of 0.179 and weighted average of 12.7%, a difference of 11.7%.
Female Poverty Correlation Summary
| Measurement | Lithuanian | Immigrants from Hungary |
| Minimum | 1.0% | 1.5% |
| Maximum | 27.5% | 29.4% |
| Range | 26.5% | 27.9% |
| Mean | 11.1% | 10.6% |
| Median | 9.8% | 9.8% |
| Interquartile 25% (IQ1) | 8.2% | 7.6% |
| Interquartile 75% (IQ3) | 13.5% | 11.8% |
| Interquartile Range (IQR) | 5.2% | 4.2% |
| Standard Deviation (Sample) | 5.7% | 6.1% |
| Standard Deviation (Population) | 5.6% | 6.0% |
Similar Demographics by Female Poverty
Demographics Similar to Lithuanians by Female Poverty
In terms of female poverty, the demographic groups most similar to Lithuanians are Latvian (11.4%, a difference of 0.32%), Immigrants from Bolivia (11.5%, a difference of 0.80%), Bolivian (11.5%, a difference of 0.87%), Immigrants from Scotland (11.5%, a difference of 0.92%), and Immigrants from Lithuania (11.3%, a difference of 0.96%).
| Demographics | Rating | Rank | Female Poverty |
| Assyrians/Chaldeans/Syriacs | 99.9 /100 | #7 | Exceptional 11.0% |
| Immigrants | South Central Asia | 99.9 /100 | #8 | Exceptional 11.1% |
| Bulgarians | 99.9 /100 | #9 | Exceptional 11.1% |
| Immigrants | Hong Kong | 99.9 /100 | #10 | Exceptional 11.2% |
| Maltese | 99.9 /100 | #11 | Exceptional 11.2% |
| Bhutanese | 99.9 /100 | #12 | Exceptional 11.3% |
| Immigrants | Lithuania | 99.9 /100 | #13 | Exceptional 11.3% |
| Lithuanians | 99.8 /100 | #14 | Exceptional 11.4% |
| Latvians | 99.8 /100 | #15 | Exceptional 11.4% |
| Immigrants | Bolivia | 99.8 /100 | #16 | Exceptional 11.5% |
| Bolivians | 99.8 /100 | #17 | Exceptional 11.5% |
| Immigrants | Scotland | 99.8 /100 | #18 | Exceptional 11.5% |
| Norwegians | 99.8 /100 | #19 | Exceptional 11.5% |
| Eastern Europeans | 99.7 /100 | #20 | Exceptional 11.5% |
| Italians | 99.7 /100 | #21 | Exceptional 11.6% |
Demographics Similar to Immigrants from Hungary by Female Poverty
In terms of female poverty, the demographic groups most similar to Immigrants from Hungary are French Canadian (12.7%, a difference of 0.040%), New Zealander (12.7%, a difference of 0.10%), Immigrants from South Eastern Asia (12.7%, a difference of 0.10%), Albanian (12.7%, a difference of 0.16%), and Sri Lankan (12.7%, a difference of 0.17%).
| Demographics | Rating | Rank | Female Poverty |
| Welsh | 91.6 /100 | #114 | Exceptional 12.7% |
| Puget Sound Salish | 91.5 /100 | #115 | Exceptional 12.7% |
| Immigrants | Russia | 91.2 /100 | #116 | Exceptional 12.7% |
| Immigrants | Southern Europe | 90.9 /100 | #117 | Exceptional 12.7% |
| Sri Lankans | 90.9 /100 | #118 | Exceptional 12.7% |
| Albanians | 90.8 /100 | #119 | Exceptional 12.7% |
| New Zealanders | 90.6 /100 | #120 | Exceptional 12.7% |
| Immigrants | Hungary | 90.3 /100 | #121 | Exceptional 12.7% |
| French Canadians | 90.2 /100 | #122 | Exceptional 12.7% |
| Immigrants | South Eastern Asia | 89.9 /100 | #123 | Excellent 12.7% |
| Immigrants | Norway | 89.3 /100 | #124 | Excellent 12.8% |
| Argentineans | 89.1 /100 | #125 | Excellent 12.8% |
| Immigrants | Ukraine | 88.8 /100 | #126 | Excellent 12.8% |
| South Africans | 88.4 /100 | #127 | Excellent 12.8% |
| Immigrants | Belarus | 88.2 /100 | #128 | Excellent 12.8% |