Sioux vs Immigrants from Croatia Female Poverty

COMPARE

Sioux
Race
Ancestry
AfghanAfricanAlaska NativeAlaskan AthabascanAlbanianAleutAlsatianAmericanApacheArabArapahoArgentineanArmenianAssyrian/Chaldean/SyriacAustralianAustrianBahamianBangladeshiBarbadianBasqueBelgianBelizeanBermudanBhutaneseBlackfeetBolivianBrazilianBritishBritish West IndianBulgarianBurmeseCajunCambodianCanadianCape VerdeanCarpatho RusynCelticCentral AmericanCentral American IndianCherokeeCheyenneChickasawChileanChineseChippewaChoctawColombianColvilleComancheCosta RicanCreeCreekCroatianCrowCubanCypriotCzechCzechoslovakianDanishDelawareDominicanDutchDutch West IndianEastern EuropeanEcuadorianEgyptianEnglishEstonianEthiopianEuropeanFijianFilipinoFinnishFrenchFrench American IndianFrench CanadianGermanGerman RussianGhanaianGreekGuamanian/ChamorroGuatemalanGuyaneseHaitianHmongHonduranHopiHoumaHungarianIcelanderIndian (Asian)IndonesianInupiatIranianIraqiIrishIroquoisIsraeliItalianJamaicanJapaneseJordanianKenyanKiowaKoreanLaotianLatvianLebaneseLiberianLithuanianLumbeeLuxembourgerMacedonianMalaysianMalteseMarshalleseMenomineeMexicanMexican American IndianMongolianMoroccanNative HawaiianNavajoNepaleseNew ZealanderNicaraguanNigerianNorthern EuropeanNorwegianOkinawanOsageOttawaPaiutePakistaniPalestinianPanamanianParaguayanPennsylvania GermanPeruvianPimaPolishPortuguesePotawatomiPuebloPuerto RicanPuget Sound SalishRomanianRussianSalvadoranSamoanScandinavianScotch-IrishScottishSeminoleSenegaleseSerbianShoshoneSierra LeoneanSiouxSlavicSlovakSloveneSomaliSouth AfricanSouth AmericanSouth American IndianSoviet UnionSpaniardSpanishSpanish AmericanSpanish American IndianSri LankanSubsaharan AfricanSudaneseSwedishSwissSyrianTaiwaneseThaiTlingit-HaidaTohono O'OdhamTonganTrinidadian and TobagonianTsimshianTurkishU.S. Virgin IslanderUgandanUkrainianUruguayanUteVenezuelanVietnameseWelshWest IndianYakamaYaquiYugoslavianYumanYup'ikZimbabwean
Immigration
NonimmigrantsImmigrantsAfghanistanAfricaAlbaniaArgentinaArmeniaAsiaAustraliaAustriaBahamasBangladeshBarbadosBelarusBelgiumBelizeBoliviaBosnia and HerzegovinaBrazilBulgariaBurma/MyanmarCabo VerdeCambodiaCameroonCanadaCaribbeanCentral AmericaChileChinaColombiaCongoCosta RicaCubaCzechoslovakiaDenmarkDominicaDominican RepublicEastern AfricaEastern AsiaEastern EuropeEcuadorEgyptEl SalvadorEnglandEritreaEthiopiaEuropeFijiFranceGermanyGhanaGreeceGrenadaGuatemalaGuyanaHaitiHondurasHong KongHungaryIndiaIndonesiaIranIraqIrelandIsraelItalyJamaicaJapanJordanKazakhstanKenyaKoreaKuwaitLaosLatin AmericaLatviaLebanonLiberiaLithuaniaMalaysiaMexicoMicronesiaMiddle AfricaMoldovaMoroccoNepalNetherlandsNicaraguaNigeriaNorth AmericaNorth MacedoniaNorthern AfricaNorthern EuropeNorwayOceaniaPakistanPanamaPeruPhilippinesPolandPortugalRomaniaRussiaSaudi ArabiaScotlandSenegalSerbiaSierra LeoneSingaporeSomaliaSouth AfricaSouth AmericaSouth Central AsiaSouth Eastern AsiaSouthern EuropeSpainSri LankaSt. Vincent and the GrenadinesSudanSwedenSwitzerlandSyriaTaiwanThailandTrinidad and TobagoTurkeyUgandaUkraineUruguayUzbekistanVenezuelaVietnamWest IndiesWestern AfricaWestern AsiaWestern EuropeYemenZaireZimbabweAzores
Immigrants from Croatia
Race
Ancestry
AfghanAfricanAlaska NativeAlaskan AthabascanAlbanianAleutAlsatianAmericanApacheArabArapahoArgentineanArmenianAssyrian/Chaldean/SyriacAustralianAustrianBahamianBangladeshiBarbadianBasqueBelgianBelizeanBermudanBhutaneseBlackfeetBolivianBrazilianBritishBritish West IndianBulgarianBurmeseCajunCambodianCanadianCape VerdeanCarpatho RusynCelticCentral AmericanCentral American IndianCherokeeCheyenneChickasawChileanChineseChippewaChoctawColombianColvilleComancheCosta RicanCreeCreekCroatianCrowCubanCypriotCzechCzechoslovakianDanishDelawareDominicanDutchDutch West IndianEastern EuropeanEcuadorianEgyptianEnglishEstonianEthiopianEuropeanFijianFilipinoFinnishFrenchFrench American IndianFrench CanadianGermanGerman RussianGhanaianGreekGuamanian/ChamorroGuatemalanGuyaneseHaitianHmongHonduranHopiHoumaHungarianIcelanderIndian (Asian)IndonesianInupiatIranianIraqiIrishIroquoisIsraeliItalianJamaicanJapaneseJordanianKenyanKiowaKoreanLaotianLatvianLebaneseLiberianLithuanianLumbeeLuxembourgerMacedonianMalaysianMalteseMarshalleseMenomineeMexicanMexican American IndianMongolianMoroccanNative HawaiianNavajoNepaleseNew ZealanderNicaraguanNigerianNorthern EuropeanNorwegianOkinawanOsageOttawaPaiutePakistaniPalestinianPanamanianParaguayanPennsylvania GermanPeruvianPimaPolishPortuguesePotawatomiPuebloPuerto RicanPuget Sound SalishRomanianRussianSalvadoranSamoanScandinavianScotch-IrishScottishSeminoleSenegaleseSerbianShoshoneSierra LeoneanSlavicSlovakSloveneSomaliSouth AfricanSouth AmericanSouth American IndianSoviet UnionSpaniardSpanishSpanish AmericanSpanish American IndianSri LankanSubsaharan AfricanSudaneseSwedishSwissSyrianTaiwaneseThaiTlingit-HaidaTohono O'OdhamTonganTrinidadian and TobagonianTsimshianTurkishU.S. Virgin IslanderUgandanUkrainianUruguayanUteVenezuelanVietnameseWelshWest IndianYakamaYaquiYugoslavianYumanYup'ikZimbabwean
Immigration
NonimmigrantsImmigrantsAfghanistanAfricaAlbaniaArgentinaArmeniaAsiaAustraliaAustriaBahamasBangladeshBarbadosBelarusBelgiumBelizeBoliviaBosnia and HerzegovinaBrazilBulgariaBurma/MyanmarCabo VerdeCambodiaCameroonCanadaCaribbeanCentral AmericaChileChinaColombiaCongoCosta RicaCroatiaCubaCzechoslovakiaDenmarkDominicaDominican RepublicEastern AfricaEastern AsiaEastern EuropeEcuadorEgyptEl SalvadorEnglandEritreaEthiopiaEuropeFijiFranceGermanyGhanaGreeceGrenadaGuatemalaGuyanaHaitiHondurasHong KongHungaryIndiaIndonesiaIranIraqIrelandIsraelItalyJamaicaJapanJordanKazakhstanKenyaKoreaKuwaitLaosLatin AmericaLatviaLebanonLiberiaLithuaniaMalaysiaMexicoMicronesiaMiddle AfricaMoldovaMoroccoNepalNetherlandsNicaraguaNigeriaNorth AmericaNorth MacedoniaNorthern AfricaNorthern EuropeNorwayOceaniaPakistanPanamaPeruPhilippinesPolandPortugalRomaniaRussiaSaudi ArabiaScotlandSenegalSerbiaSierra LeoneSingaporeSomaliaSouth AfricaSouth AmericaSouth Central AsiaSouth Eastern AsiaSouthern EuropeSpainSri LankaSt. Vincent and the GrenadinesSudanSwedenSwitzerlandSyriaTaiwanThailandTrinidad and TobagoTurkeyUgandaUkraineUruguayUzbekistanVenezuelaVietnamWest IndiesWestern AfricaWestern AsiaWestern EuropeYemenZaireZimbabweAzores
Female Poverty
Income
Poverty
Unemployment
Labor Participation
Family Structure
Vehicle Availability
Education Level
Disability

Female Poverty Comparison

Sioux

Immigrants from Croatia

Tragic
Exceptional
20.9%
FEMALE POVERTY
0.0/ 100
METRIC RATING
338th/ 347
METRIC RANK
12.0%
FEMALE POVERTY
98.7/ 100
METRIC RATING
52nd/ 347
METRIC RANK

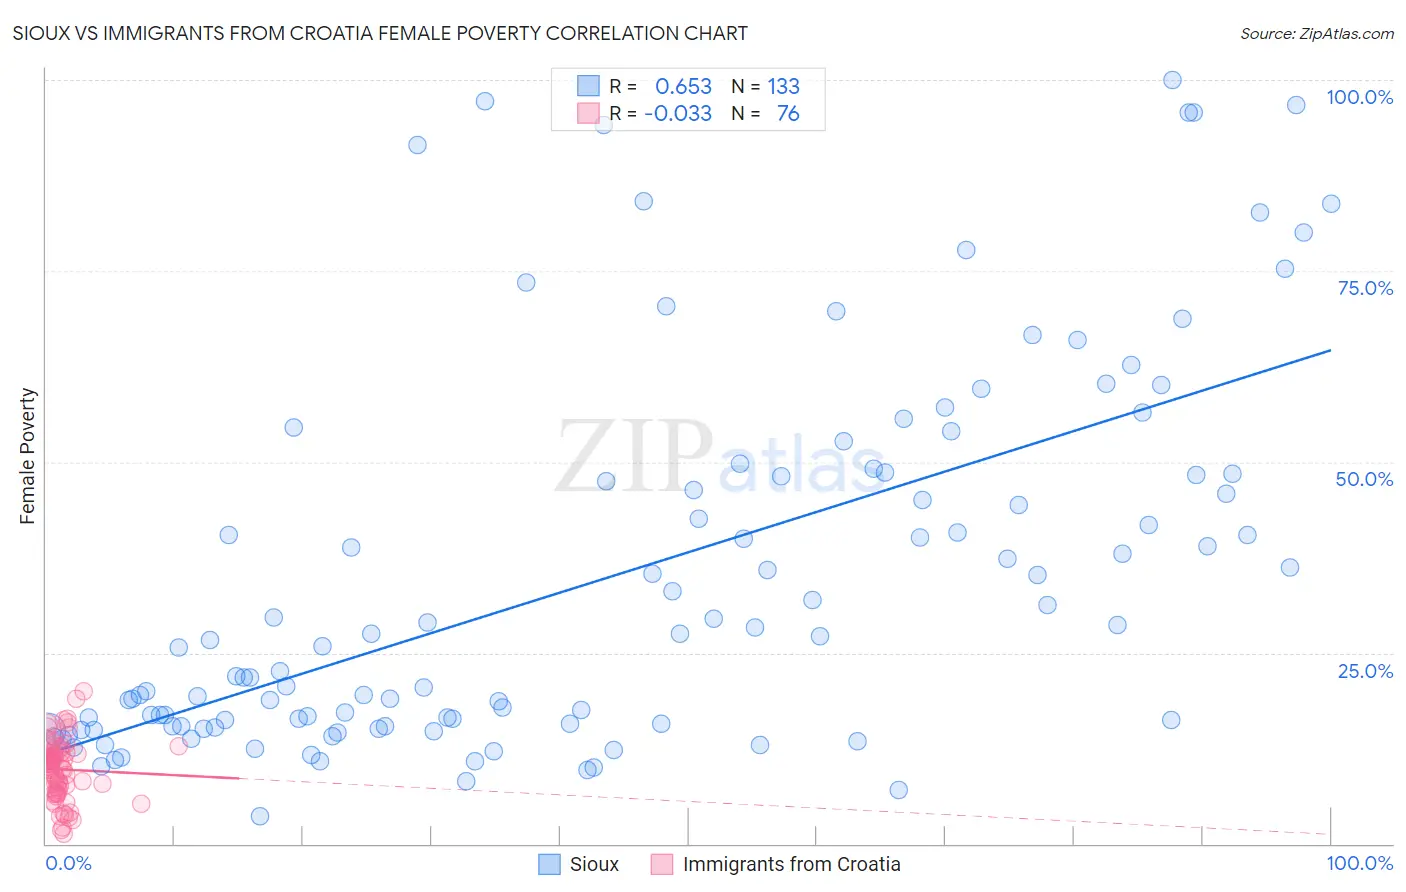
Sioux vs Immigrants from Croatia Female Poverty Correlation Chart

The statistical analysis conducted on geographies consisting of 234,087,584 people shows a significant positive correlation between the proportion of Sioux and poverty level among females in the United States with a correlation coefficient (R) of 0.653 and weighted average of 20.9%. Similarly, the statistical analysis conducted on geographies consisting of 132,555,435 people shows no correlation between the proportion of Immigrants from Croatia and poverty level among females in the United States with a correlation coefficient (R) of -0.033 and weighted average of 12.0%, a difference of 73.5%.
Sioux vs Immigrants from Croatia Female Poverty

Female Poverty Correlation Summary

MeasurementSiouxImmigrants from Croatia
Minimum3.5%1.3%
Maximum100.0%20.0%
Range96.5%18.7%
Mean34.8%9.7%
Median26.7%10.3%
Interquartile 25% (IQ1)15.4%7.1%
Interquartile 75% (IQ3)48.4%11.9%
Interquartile Range (IQR)33.0%4.8%
Standard Deviation (Sample)24.5%3.9%
Standard Deviation (Population)24.4%3.9%

Similar Demographics by Female Poverty

Demographics Similar to Sioux by Female Poverty

In terms of female poverty, the demographic groups most similar to Sioux are Yuman (20.8%, a difference of 0.19%), Hopi (21.0%, a difference of 0.37%), Pueblo (20.7%, a difference of 1.0%), Yup'ik (21.5%, a difference of 2.9%), and Cheyenne (20.2%, a difference of 3.4%).
DemographicsRating | RankFemale Poverty
Natives/Alaskans
0.0
/100
|
#331
Tragic
19.2%
Apache
0.0
/100
|
#332
Tragic
19.2%
Immigrants | Dominican Republic
0.0
/100
|
#333
Tragic
19.3%
Houma
0.0
/100
|
#334
Tragic
20.0%
Cheyenne
0.0
/100
|
#335
Tragic
20.2%
Pueblo
0.0
/100
|
#336
Tragic
20.7%
Yuman
0.0
/100
|
#337
Tragic
20.8%
Sioux
0.0
/100
|
#338
Tragic
20.9%
Hopi
0.0
/100
|
#339
Tragic
21.0%
Yup'ik
0.0
/100
|
#340
Tragic
21.5%
Crow
0.0
/100
|
#341
Tragic
22.1%
Immigrants | Yemen
0.0
/100
|
#342
Tragic
22.8%
Lumbee
0.0
/100
|
#343
Tragic
23.5%
Pima
0.0
/100
|
#344
Tragic
23.6%
Navajo
0.0
/100
|
#345
Tragic
23.9%

Demographics Similar to Immigrants from Croatia by Female Poverty

In terms of female poverty, the demographic groups most similar to Immigrants from Croatia are Immigrants from Austria (12.0%, a difference of 0.010%), Immigrants from Philippines (12.1%, a difference of 0.15%), Immigrants from Bulgaria (12.0%, a difference of 0.31%), Immigrants from Sri Lanka (12.1%, a difference of 0.50%), and Slovene (12.0%, a difference of 0.52%).
DemographicsRating | RankFemale Poverty
Immigrants | Czechoslovakia
99.2
/100
|
#45
Exceptional
11.9%
Turks
99.2
/100
|
#46
Exceptional
11.9%
Asians
99.1
/100
|
#47
Exceptional
11.9%
Immigrants | Japan
99.0
/100
|
#48
Exceptional
11.9%
Immigrants | Romania
99.0
/100
|
#49
Exceptional
12.0%
Slovenes
98.9
/100
|
#50
Exceptional
12.0%
Immigrants | Bulgaria
98.9
/100
|
#51
Exceptional
12.0%
Immigrants | Croatia
98.7
/100
|
#52
Exceptional
12.0%
Immigrants | Austria
98.7
/100
|
#53
Exceptional
12.0%
Immigrants | Philippines
98.7
/100
|
#54
Exceptional
12.1%
Immigrants | Sri Lanka
98.5
/100
|
#55
Exceptional
12.1%
Estonians
98.3
/100
|
#56
Exceptional
12.1%
Immigrants | Serbia
98.3
/100
|
#57
Exceptional
12.1%
Scandinavians
98.2
/100
|
#58
Exceptional
12.1%
Immigrants | Europe
98.2
/100
|
#59
Exceptional
12.1%