Senegalese vs Immigrants from Middle Africa Female Poverty
COMPARE
Senegalese
Immigrants from Middle Africa
Female Poverty
Female Poverty Comparison
Senegalese
Immigrants from Middle Africa
16.5%
FEMALE POVERTY
0.0/ 100
METRIC RATING
295th/ 347
METRIC RANK
15.2%
FEMALE POVERTY
0.5/ 100
METRIC RATING
239th/ 347
METRIC RANK
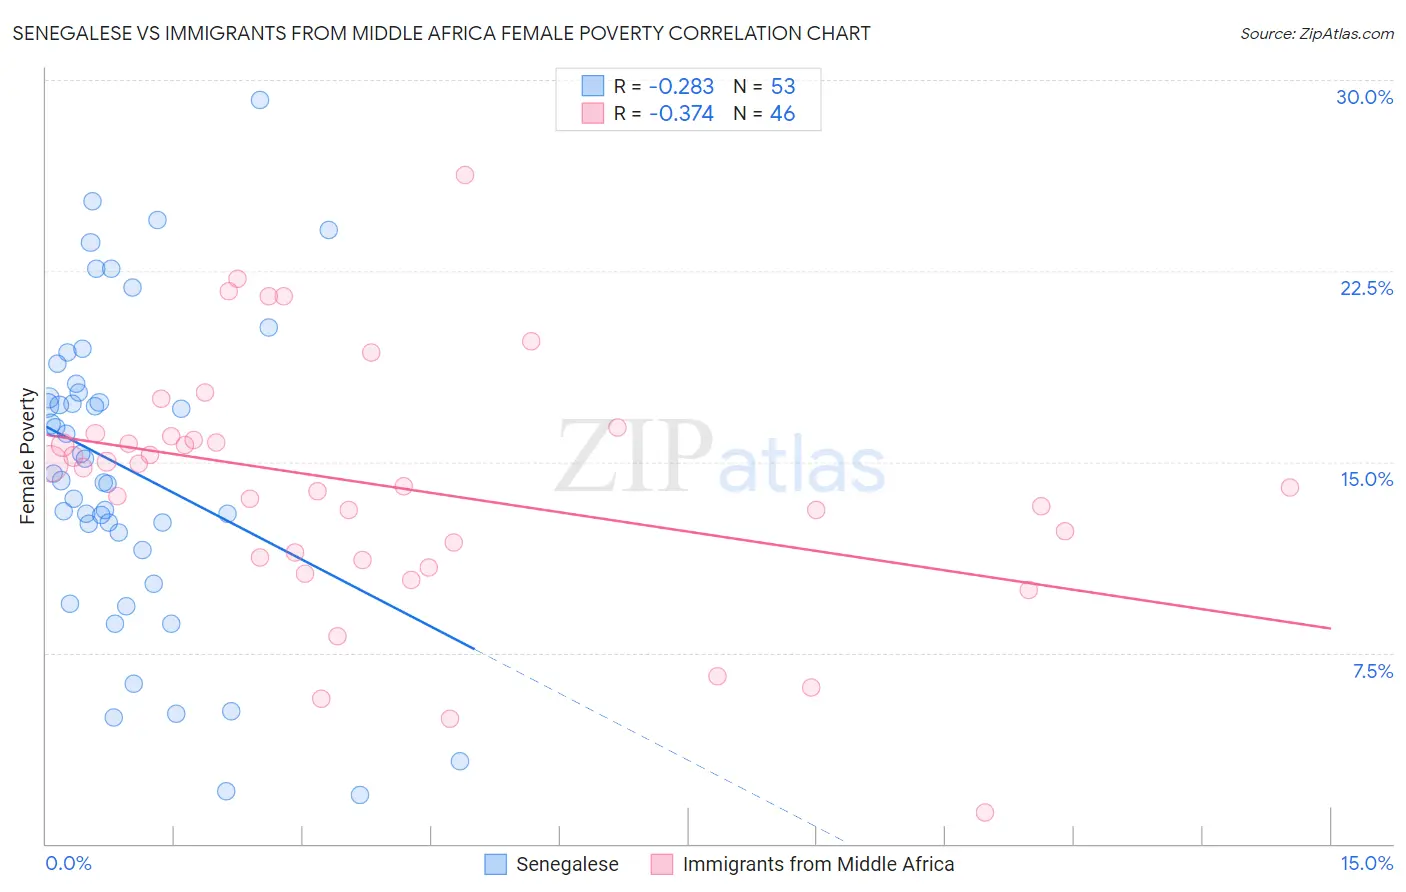
Senegalese vs Immigrants from Middle Africa Female Poverty Correlation Chart
The statistical analysis conducted on geographies consisting of 78,099,565 people shows a weak negative correlation between the proportion of Senegalese and poverty level among females in the United States with a correlation coefficient (R) of -0.283 and weighted average of 16.5%. Similarly, the statistical analysis conducted on geographies consisting of 202,623,141 people shows a mild negative correlation between the proportion of Immigrants from Middle Africa and poverty level among females in the United States with a correlation coefficient (R) of -0.374 and weighted average of 15.2%, a difference of 8.4%.
Female Poverty Correlation Summary
| Measurement | Senegalese | Immigrants from Middle Africa |
| Minimum | 1.9% | 1.2% |
| Maximum | 29.2% | 26.2% |
| Range | 27.3% | 25.0% |
| Mean | 14.7% | 14.0% |
| Median | 14.5% | 14.4% |
| Interquartile 25% (IQ1) | 11.9% | 11.2% |
| Interquartile 75% (IQ3) | 17.9% | 16.0% |
| Interquartile Range (IQR) | 6.0% | 4.8% |
| Standard Deviation (Sample) | 6.1% | 4.9% |
| Standard Deviation (Population) | 6.0% | 4.8% |
Similar Demographics by Female Poverty
Demographics Similar to Senegalese by Female Poverty
In terms of female poverty, the demographic groups most similar to Senegalese are Immigrants from Senegal (16.5%, a difference of 0.020%), Immigrants from Cabo Verde (16.4%, a difference of 0.080%), Immigrants from Latin America (16.4%, a difference of 0.11%), Immigrants from Zaire (16.4%, a difference of 0.17%), and Yaqui (16.4%, a difference of 0.18%).
| Demographics | Rating | Rank | Female Poverty |
| Indonesians | 0.0 /100 | #288 | Tragic 16.4% |
| Blackfeet | 0.0 /100 | #289 | Tragic 16.4% |
| Immigrants | Bangladesh | 0.0 /100 | #290 | Tragic 16.4% |
| Yaqui | 0.0 /100 | #291 | Tragic 16.4% |
| Immigrants | Zaire | 0.0 /100 | #292 | Tragic 16.4% |
| Immigrants | Latin America | 0.0 /100 | #293 | Tragic 16.4% |
| Immigrants | Cabo Verde | 0.0 /100 | #294 | Tragic 16.4% |
| Senegalese | 0.0 /100 | #295 | Tragic 16.5% |
| Immigrants | Senegal | 0.0 /100 | #296 | Tragic 16.5% |
| Mexicans | 0.0 /100 | #297 | Tragic 16.5% |
| Somalis | 0.0 /100 | #298 | Tragic 16.6% |
| Hispanics or Latinos | 0.0 /100 | #299 | Tragic 16.6% |
| Bahamians | 0.0 /100 | #300 | Tragic 16.6% |
| Guatemalans | 0.0 /100 | #301 | Tragic 16.7% |
| Chippewa | 0.0 /100 | #302 | Tragic 16.7% |
Demographics Similar to Immigrants from Middle Africa by Female Poverty
In terms of female poverty, the demographic groups most similar to Immigrants from Middle Africa are Sudanese (15.2%, a difference of 0.050%), Immigrants from Sudan (15.2%, a difference of 0.30%), Nepalese (15.2%, a difference of 0.42%), Immigrants from Armenia (15.1%, a difference of 0.52%), and French American Indian (15.1%, a difference of 0.59%).
| Demographics | Rating | Rank | Female Poverty |
| Osage | 1.5 /100 | #232 | Tragic 14.8% |
| Immigrants | Saudi Arabia | 1.4 /100 | #233 | Tragic 14.8% |
| Fijians | 1.1 /100 | #234 | Tragic 14.9% |
| Immigrants | Laos | 0.9 /100 | #235 | Tragic 15.0% |
| Cree | 0.7 /100 | #236 | Tragic 15.1% |
| French American Indians | 0.6 /100 | #237 | Tragic 15.1% |
| Immigrants | Armenia | 0.6 /100 | #238 | Tragic 15.1% |
| Immigrants | Middle Africa | 0.5 /100 | #239 | Tragic 15.2% |
| Sudanese | 0.5 /100 | #240 | Tragic 15.2% |
| Immigrants | Sudan | 0.4 /100 | #241 | Tragic 15.2% |
| Nepalese | 0.4 /100 | #242 | Tragic 15.2% |
| Nicaraguans | 0.3 /100 | #243 | Tragic 15.3% |
| Ecuadorians | 0.3 /100 | #244 | Tragic 15.3% |
| Spanish American Indians | 0.3 /100 | #245 | Tragic 15.3% |
| Cubans | 0.3 /100 | #246 | Tragic 15.3% |