Scandinavian vs Immigrants from Czechoslovakia Single Female Poverty
COMPARE
Scandinavian
Immigrants from Czechoslovakia
Single Female Poverty
Single Female Poverty Comparison
Scandinavians
Immigrants from Czechoslovakia
21.1%
SINGLE FEMALE POVERTY
45.2/ 100
METRIC RATING
177th/ 347
METRIC RANK
19.0%
SINGLE FEMALE POVERTY
99.8/ 100
METRIC RATING
49th/ 347
METRIC RANK
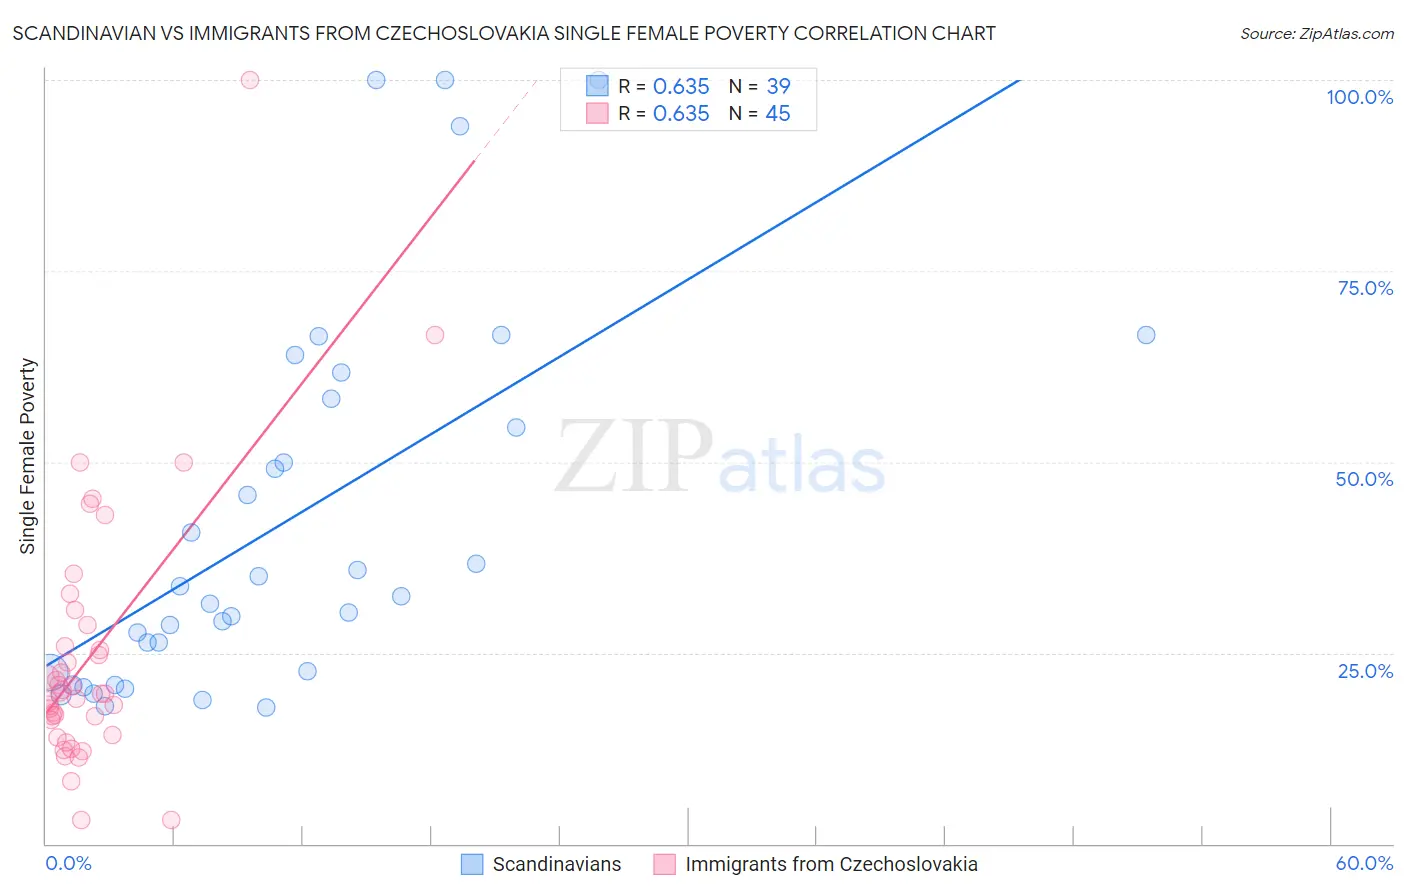
Scandinavian vs Immigrants from Czechoslovakia Single Female Poverty Correlation Chart
The statistical analysis conducted on geographies consisting of 461,288,786 people shows a significant positive correlation between the proportion of Scandinavians and poverty level among single females in the United States with a correlation coefficient (R) of 0.635 and weighted average of 21.1%. Similarly, the statistical analysis conducted on geographies consisting of 193,433,983 people shows a significant positive correlation between the proportion of Immigrants from Czechoslovakia and poverty level among single females in the United States with a correlation coefficient (R) of 0.635 and weighted average of 19.0%, a difference of 10.7%.
Single Female Poverty Correlation Summary
| Measurement | Scandinavian | Immigrants from Czechoslovakia |
| Minimum | 17.8% | 3.1% |
| Maximum | 100.0% | 100.0% |
| Range | 82.2% | 96.9% |
| Mean | 42.1% | 24.5% |
| Median | 32.4% | 19.6% |
| Interquartile 25% (IQ1) | 22.3% | 15.2% |
| Interquartile 75% (IQ3) | 58.3% | 27.2% |
| Interquartile Range (IQR) | 36.0% | 12.0% |
| Standard Deviation (Sample) | 24.6% | 17.3% |
| Standard Deviation (Population) | 24.3% | 17.1% |
Similar Demographics by Single Female Poverty
Demographics Similar to Scandinavians by Single Female Poverty
In terms of single female poverty, the demographic groups most similar to Scandinavians are Canadian (21.1%, a difference of 0.010%), Immigrants from Bosnia and Herzegovina (21.1%, a difference of 0.020%), Czech (21.0%, a difference of 0.10%), British (21.1%, a difference of 0.14%), and Spanish American Indian (21.1%, a difference of 0.17%).
| Demographics | Rating | Rank | Single Female Poverty |
| New Zealanders | 53.2 /100 | #170 | Average 21.0% |
| Moroccans | 52.8 /100 | #171 | Average 21.0% |
| Guyanese | 52.0 /100 | #172 | Average 21.0% |
| Immigrants | Guyana | 50.6 /100 | #173 | Average 21.0% |
| Cubans | 50.0 /100 | #174 | Average 21.0% |
| Czechs | 46.8 /100 | #175 | Average 21.0% |
| Canadians | 45.4 /100 | #176 | Average 21.1% |
| Scandinavians | 45.2 /100 | #177 | Average 21.1% |
| Immigrants | Bosnia and Herzegovina | 44.9 /100 | #178 | Average 21.1% |
| British | 42.9 /100 | #179 | Average 21.1% |
| Spanish American Indians | 42.5 /100 | #180 | Average 21.1% |
| Europeans | 42.3 /100 | #181 | Average 21.1% |
| Slavs | 40.5 /100 | #182 | Average 21.1% |
| Slovaks | 39.7 /100 | #183 | Fair 21.1% |
| Hungarians | 39.6 /100 | #184 | Fair 21.1% |
Demographics Similar to Immigrants from Czechoslovakia by Single Female Poverty
In terms of single female poverty, the demographic groups most similar to Immigrants from Czechoslovakia are Immigrants from Argentina (19.0%, a difference of 0.010%), Immigrants from Eastern Europe (19.0%, a difference of 0.040%), Immigrants from Italy (19.0%, a difference of 0.080%), Egyptian (19.1%, a difference of 0.12%), and Latvian (19.0%, a difference of 0.29%).
| Demographics | Rating | Rank | Single Female Poverty |
| Jordanians | 99.9 /100 | #42 | Exceptional 18.8% |
| Immigrants | Romania | 99.9 /100 | #43 | Exceptional 18.8% |
| Immigrants | Croatia | 99.9 /100 | #44 | Exceptional 18.9% |
| Immigrants | Indonesia | 99.8 /100 | #45 | Exceptional 18.9% |
| Macedonians | 99.8 /100 | #46 | Exceptional 18.9% |
| Latvians | 99.8 /100 | #47 | Exceptional 19.0% |
| Immigrants | Argentina | 99.8 /100 | #48 | Exceptional 19.0% |
| Immigrants | Czechoslovakia | 99.8 /100 | #49 | Exceptional 19.0% |
| Immigrants | Eastern Europe | 99.8 /100 | #50 | Exceptional 19.0% |
| Immigrants | Italy | 99.8 /100 | #51 | Exceptional 19.0% |
| Egyptians | 99.7 /100 | #52 | Exceptional 19.1% |
| Tsimshian | 99.7 /100 | #53 | Exceptional 19.1% |
| Argentineans | 99.7 /100 | #54 | Exceptional 19.1% |
| Immigrants | Vietnam | 99.7 /100 | #55 | Exceptional 19.1% |
| Immigrants | Fiji | 99.7 /100 | #56 | Exceptional 19.1% |