Filipino vs Immigrants from Czechoslovakia Single Female Poverty
COMPARE
Filipino
Immigrants from Czechoslovakia
Single Female Poverty
Single Female Poverty Comparison
Filipinos
Immigrants from Czechoslovakia
17.0%
SINGLE FEMALE POVERTY
100.0/ 100
METRIC RATING
6th/ 347
METRIC RANK
19.0%
SINGLE FEMALE POVERTY
99.8/ 100
METRIC RATING
49th/ 347
METRIC RANK
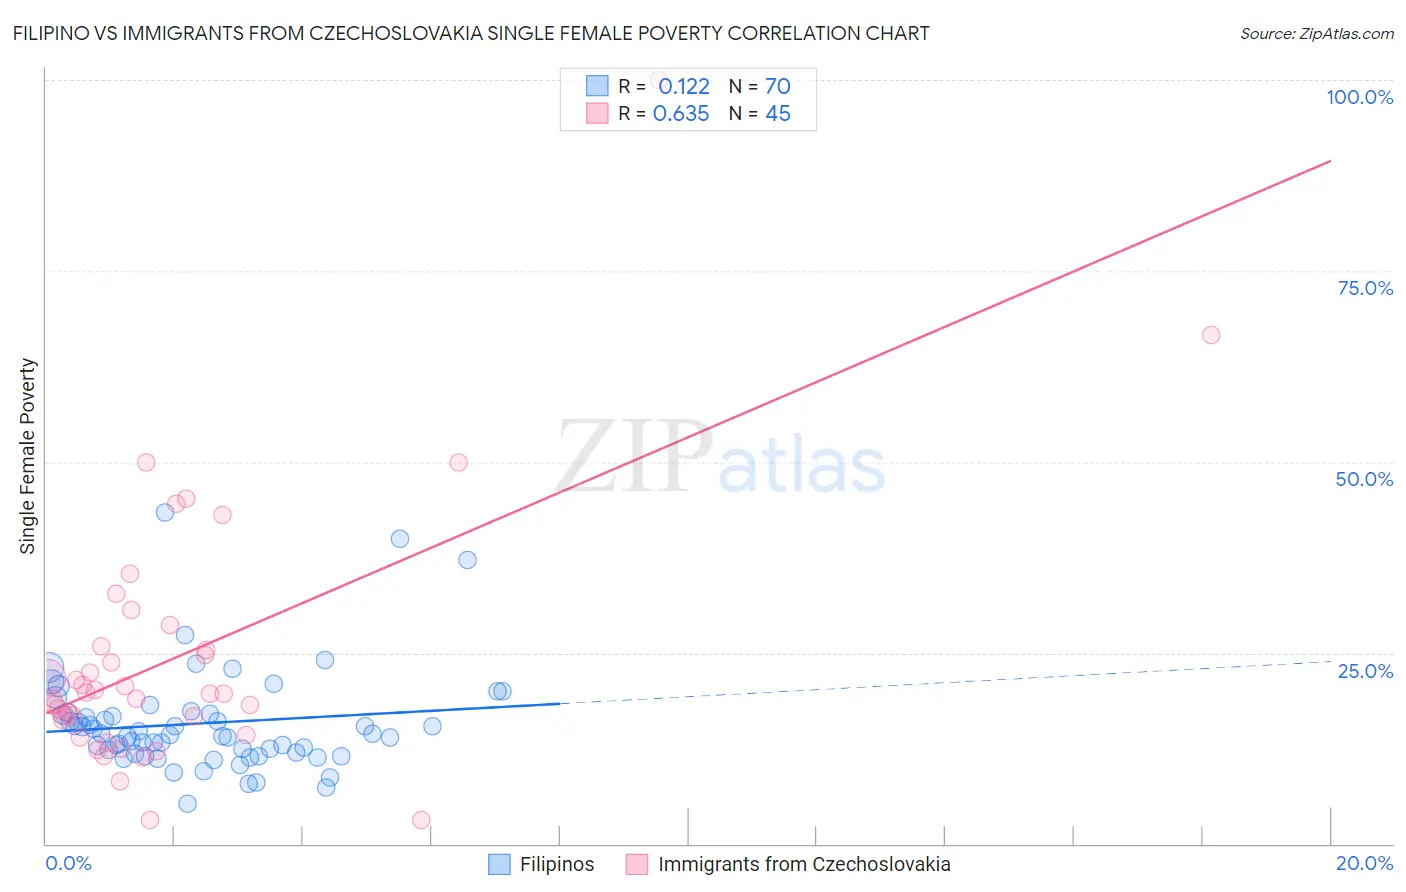
Filipino vs Immigrants from Czechoslovakia Single Female Poverty Correlation Chart
The statistical analysis conducted on geographies consisting of 251,336,668 people shows a poor positive correlation between the proportion of Filipinos and poverty level among single females in the United States with a correlation coefficient (R) of 0.122 and weighted average of 17.0%. Similarly, the statistical analysis conducted on geographies consisting of 193,433,983 people shows a significant positive correlation between the proportion of Immigrants from Czechoslovakia and poverty level among single females in the United States with a correlation coefficient (R) of 0.635 and weighted average of 19.0%, a difference of 12.0%.
Single Female Poverty Correlation Summary
| Measurement | Filipino | Immigrants from Czechoslovakia |
| Minimum | 5.2% | 3.1% |
| Maximum | 43.4% | 100.0% |
| Range | 38.2% | 96.9% |
| Mean | 15.8% | 24.5% |
| Median | 14.3% | 19.6% |
| Interquartile 25% (IQ1) | 12.0% | 15.2% |
| Interquartile 75% (IQ3) | 17.1% | 27.2% |
| Interquartile Range (IQR) | 5.1% | 12.0% |
| Standard Deviation (Sample) | 6.7% | 17.3% |
| Standard Deviation (Population) | 6.7% | 17.1% |
Similar Demographics by Single Female Poverty
Demographics Similar to Filipinos by Single Female Poverty
In terms of single female poverty, the demographic groups most similar to Filipinos are Assyrian/Chaldean/Syriac (17.0%, a difference of 0.20%), Immigrants from India (16.8%, a difference of 1.0%), Thai (17.3%, a difference of 1.7%), Immigrants from Iran (17.5%, a difference of 2.8%), and Immigrants from Hong Kong (16.5%, a difference of 2.8%).
| Demographics | Rating | Rank | Single Female Poverty |
| Chinese | 100.0 /100 | #1 | Exceptional 16.1% |
| Immigrants | Taiwan | 100.0 /100 | #2 | Exceptional 16.4% |
| Immigrants | Hong Kong | 100.0 /100 | #3 | Exceptional 16.5% |
| Immigrants | India | 100.0 /100 | #4 | Exceptional 16.8% |
| Assyrians/Chaldeans/Syriacs | 100.0 /100 | #5 | Exceptional 17.0% |
| Filipinos | 100.0 /100 | #6 | Exceptional 17.0% |
| Thais | 100.0 /100 | #7 | Exceptional 17.3% |
| Immigrants | Iran | 100.0 /100 | #8 | Exceptional 17.5% |
| Bhutanese | 100.0 /100 | #9 | Exceptional 17.7% |
| Immigrants | Ireland | 100.0 /100 | #10 | Exceptional 17.8% |
| Immigrants | Lithuania | 100.0 /100 | #11 | Exceptional 17.8% |
| Immigrants | South Central Asia | 100.0 /100 | #12 | Exceptional 17.8% |
| Immigrants | Bolivia | 100.0 /100 | #13 | Exceptional 17.8% |
| Bolivians | 100.0 /100 | #14 | Exceptional 17.9% |
| Indians (Asian) | 100.0 /100 | #15 | Exceptional 17.9% |
Demographics Similar to Immigrants from Czechoslovakia by Single Female Poverty
In terms of single female poverty, the demographic groups most similar to Immigrants from Czechoslovakia are Immigrants from Argentina (19.0%, a difference of 0.010%), Immigrants from Eastern Europe (19.0%, a difference of 0.040%), Immigrants from Italy (19.0%, a difference of 0.080%), Egyptian (19.1%, a difference of 0.12%), and Latvian (19.0%, a difference of 0.29%).
| Demographics | Rating | Rank | Single Female Poverty |
| Jordanians | 99.9 /100 | #42 | Exceptional 18.8% |
| Immigrants | Romania | 99.9 /100 | #43 | Exceptional 18.8% |
| Immigrants | Croatia | 99.9 /100 | #44 | Exceptional 18.9% |
| Immigrants | Indonesia | 99.8 /100 | #45 | Exceptional 18.9% |
| Macedonians | 99.8 /100 | #46 | Exceptional 18.9% |
| Latvians | 99.8 /100 | #47 | Exceptional 19.0% |
| Immigrants | Argentina | 99.8 /100 | #48 | Exceptional 19.0% |
| Immigrants | Czechoslovakia | 99.8 /100 | #49 | Exceptional 19.0% |
| Immigrants | Eastern Europe | 99.8 /100 | #50 | Exceptional 19.0% |
| Immigrants | Italy | 99.8 /100 | #51 | Exceptional 19.0% |
| Egyptians | 99.7 /100 | #52 | Exceptional 19.1% |
| Tsimshian | 99.7 /100 | #53 | Exceptional 19.1% |
| Argentineans | 99.7 /100 | #54 | Exceptional 19.1% |
| Immigrants | Vietnam | 99.7 /100 | #55 | Exceptional 19.1% |
| Immigrants | Fiji | 99.7 /100 | #56 | Exceptional 19.1% |