Aleut vs Immigrants from Czechoslovakia Single Female Poverty
COMPARE
Aleut
Immigrants from Czechoslovakia
Single Female Poverty
Single Female Poverty Comparison
Aleuts
Immigrants from Czechoslovakia
25.4%
SINGLE FEMALE POVERTY
0.0/ 100
METRIC RATING
308th/ 347
METRIC RANK
19.0%
SINGLE FEMALE POVERTY
99.8/ 100
METRIC RATING
49th/ 347
METRIC RANK
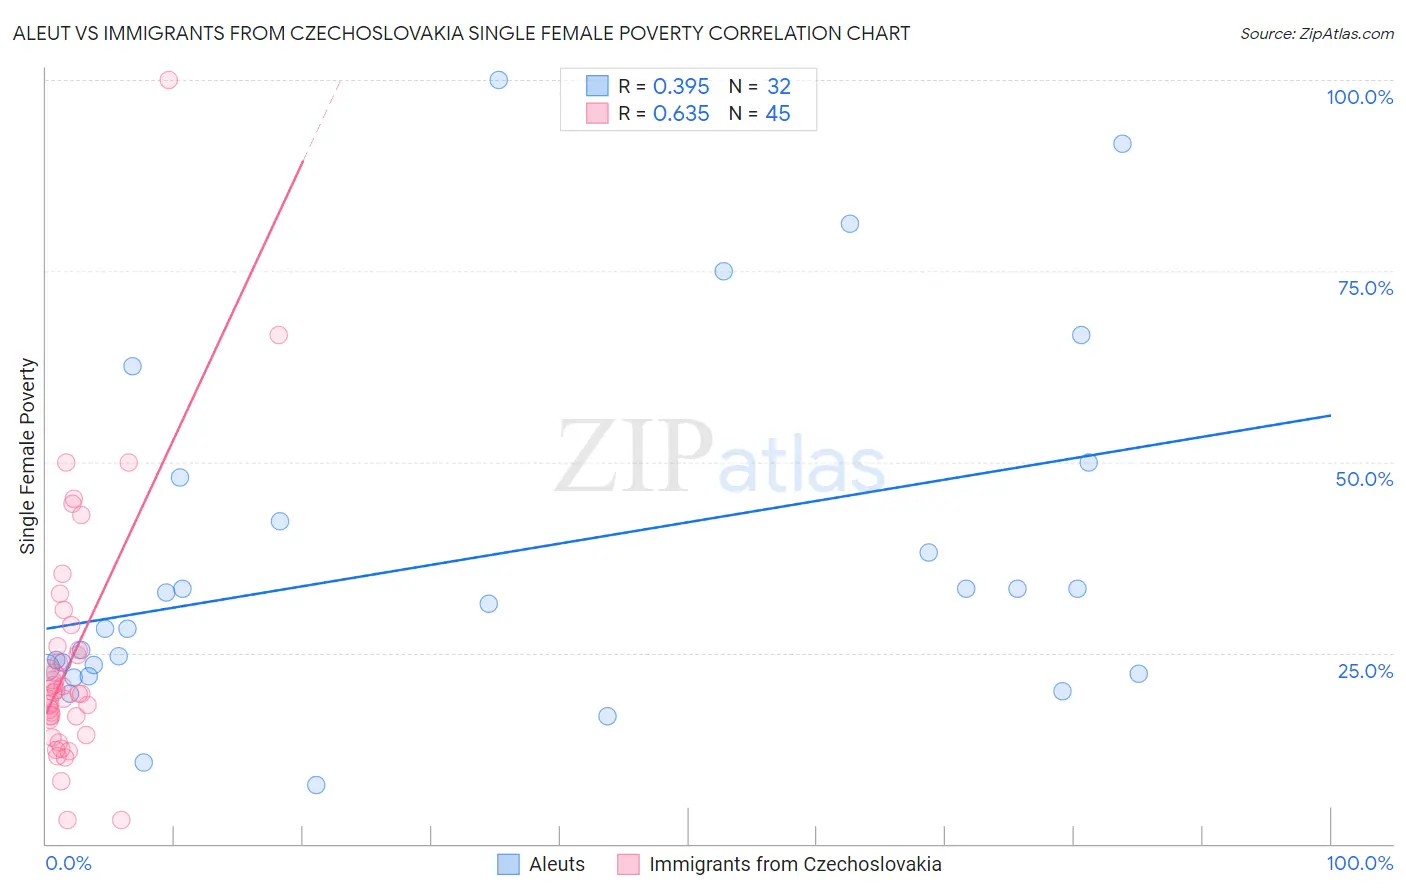
Aleut vs Immigrants from Czechoslovakia Single Female Poverty Correlation Chart
The statistical analysis conducted on geographies consisting of 61,521,342 people shows a mild positive correlation between the proportion of Aleuts and poverty level among single females in the United States with a correlation coefficient (R) of 0.395 and weighted average of 25.4%. Similarly, the statistical analysis conducted on geographies consisting of 193,433,983 people shows a significant positive correlation between the proportion of Immigrants from Czechoslovakia and poverty level among single females in the United States with a correlation coefficient (R) of 0.635 and weighted average of 19.0%, a difference of 33.5%.
Single Female Poverty Correlation Summary
| Measurement | Aleut | Immigrants from Czechoslovakia |
| Minimum | 7.7% | 3.1% |
| Maximum | 100.0% | 100.0% |
| Range | 92.3% | 96.9% |
| Mean | 37.3% | 24.5% |
| Median | 29.8% | 19.6% |
| Interquartile 25% (IQ1) | 22.7% | 15.2% |
| Interquartile 75% (IQ3) | 45.1% | 27.2% |
| Interquartile Range (IQR) | 22.4% | 12.0% |
| Standard Deviation (Sample) | 23.2% | 17.3% |
| Standard Deviation (Population) | 22.8% | 17.1% |
Similar Demographics by Single Female Poverty
Demographics Similar to Aleuts by Single Female Poverty
In terms of single female poverty, the demographic groups most similar to Aleuts are Dominican (25.4%, a difference of 0.010%), Central American Indian (25.5%, a difference of 0.16%), Potawatomi (25.4%, a difference of 0.17%), Immigrants from Mexico (25.3%, a difference of 0.39%), and Immigrants from Honduras (25.5%, a difference of 0.44%).
| Demographics | Rating | Rank | Single Female Poverty |
| Hondurans | 0.0 /100 | #301 | Tragic 25.1% |
| Shoshone | 0.0 /100 | #302 | Tragic 25.1% |
| Somalis | 0.0 /100 | #303 | Tragic 25.2% |
| Immigrants | Congo | 0.0 /100 | #304 | Tragic 25.3% |
| Immigrants | Dominican Republic | 0.0 /100 | #305 | Tragic 25.3% |
| Immigrants | Mexico | 0.0 /100 | #306 | Tragic 25.3% |
| Potawatomi | 0.0 /100 | #307 | Tragic 25.4% |
| Aleuts | 0.0 /100 | #308 | Tragic 25.4% |
| Dominicans | 0.0 /100 | #309 | Tragic 25.4% |
| Central American Indians | 0.0 /100 | #310 | Tragic 25.5% |
| Immigrants | Honduras | 0.0 /100 | #311 | Tragic 25.5% |
| Paiute | 0.0 /100 | #312 | Tragic 25.5% |
| Comanche | 0.0 /100 | #313 | Tragic 25.6% |
| Cherokee | 0.0 /100 | #314 | Tragic 25.7% |
| Iroquois | 0.0 /100 | #315 | Tragic 25.7% |
Demographics Similar to Immigrants from Czechoslovakia by Single Female Poverty
In terms of single female poverty, the demographic groups most similar to Immigrants from Czechoslovakia are Immigrants from Argentina (19.0%, a difference of 0.010%), Immigrants from Eastern Europe (19.0%, a difference of 0.040%), Immigrants from Italy (19.0%, a difference of 0.080%), Egyptian (19.1%, a difference of 0.12%), and Latvian (19.0%, a difference of 0.29%).
| Demographics | Rating | Rank | Single Female Poverty |
| Jordanians | 99.9 /100 | #42 | Exceptional 18.8% |
| Immigrants | Romania | 99.9 /100 | #43 | Exceptional 18.8% |
| Immigrants | Croatia | 99.9 /100 | #44 | Exceptional 18.9% |
| Immigrants | Indonesia | 99.8 /100 | #45 | Exceptional 18.9% |
| Macedonians | 99.8 /100 | #46 | Exceptional 18.9% |
| Latvians | 99.8 /100 | #47 | Exceptional 19.0% |
| Immigrants | Argentina | 99.8 /100 | #48 | Exceptional 19.0% |
| Immigrants | Czechoslovakia | 99.8 /100 | #49 | Exceptional 19.0% |
| Immigrants | Eastern Europe | 99.8 /100 | #50 | Exceptional 19.0% |
| Immigrants | Italy | 99.8 /100 | #51 | Exceptional 19.0% |
| Egyptians | 99.7 /100 | #52 | Exceptional 19.1% |
| Tsimshian | 99.7 /100 | #53 | Exceptional 19.1% |
| Argentineans | 99.7 /100 | #54 | Exceptional 19.1% |
| Immigrants | Vietnam | 99.7 /100 | #55 | Exceptional 19.1% |
| Immigrants | Fiji | 99.7 /100 | #56 | Exceptional 19.1% |