Scandinavian vs Comanche Single Female Poverty
COMPARE
Scandinavian
Comanche
Single Female Poverty
Single Female Poverty Comparison
Scandinavians
Comanche
21.1%
SINGLE FEMALE POVERTY
45.2/ 100
METRIC RATING
177th/ 347
METRIC RANK
25.6%
SINGLE FEMALE POVERTY
0.0/ 100
METRIC RATING
313th/ 347
METRIC RANK
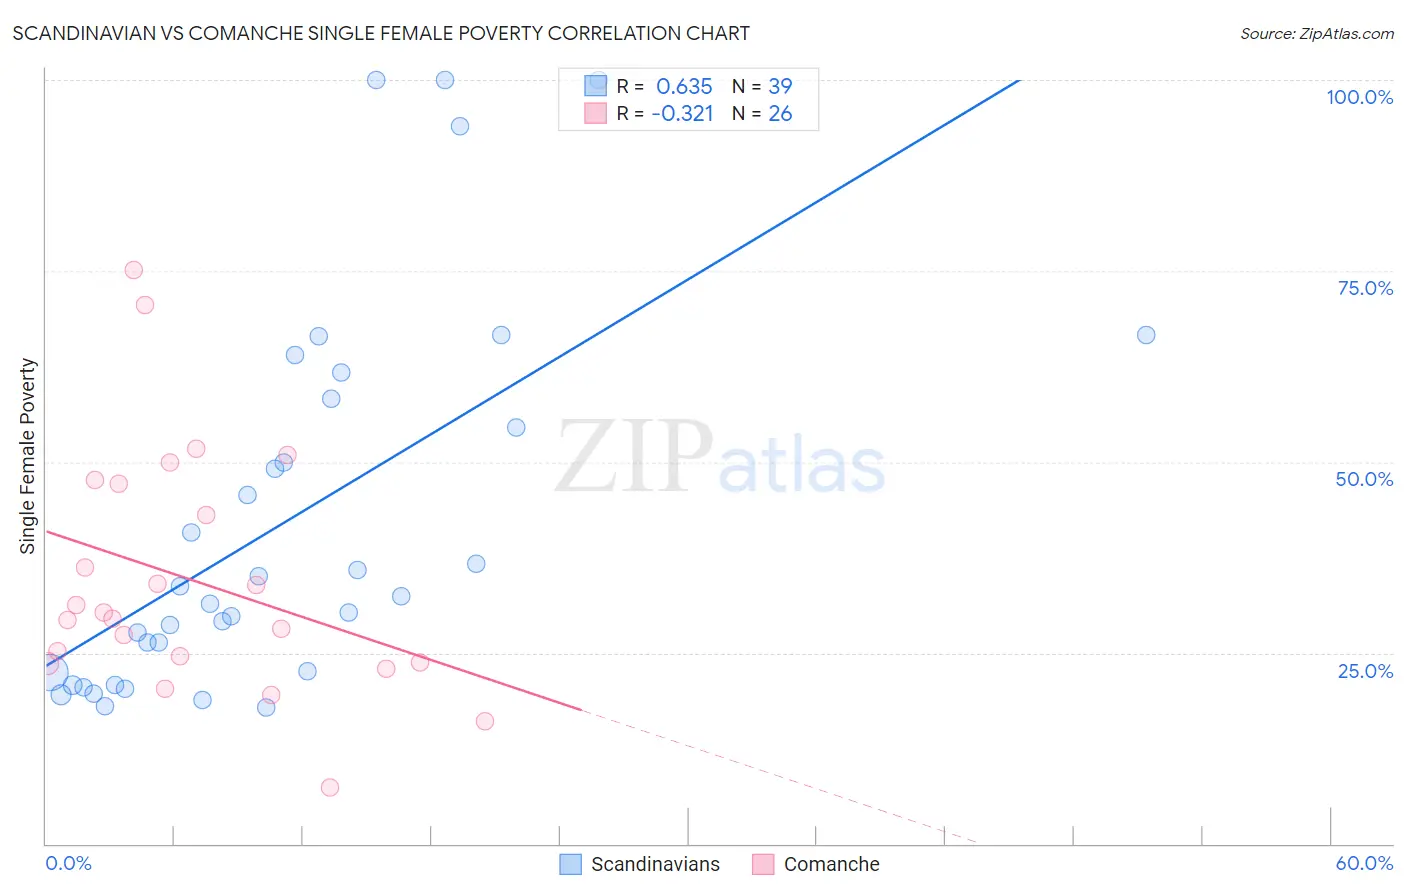
Scandinavian vs Comanche Single Female Poverty Correlation Chart
The statistical analysis conducted on geographies consisting of 461,288,786 people shows a significant positive correlation between the proportion of Scandinavians and poverty level among single females in the United States with a correlation coefficient (R) of 0.635 and weighted average of 21.1%. Similarly, the statistical analysis conducted on geographies consisting of 109,354,794 people shows a mild negative correlation between the proportion of Comanche and poverty level among single females in the United States with a correlation coefficient (R) of -0.321 and weighted average of 25.6%, a difference of 21.3%.
Single Female Poverty Correlation Summary
| Measurement | Scandinavian | Comanche |
| Minimum | 17.8% | 7.4% |
| Maximum | 100.0% | 75.2% |
| Range | 82.2% | 67.8% |
| Mean | 42.1% | 34.6% |
| Median | 32.4% | 29.9% |
| Interquartile 25% (IQ1) | 22.3% | 23.8% |
| Interquartile 75% (IQ3) | 58.3% | 47.1% |
| Interquartile Range (IQR) | 36.0% | 23.3% |
| Standard Deviation (Sample) | 24.6% | 16.0% |
| Standard Deviation (Population) | 24.3% | 15.7% |
Similar Demographics by Single Female Poverty
Demographics Similar to Scandinavians by Single Female Poverty
In terms of single female poverty, the demographic groups most similar to Scandinavians are Canadian (21.1%, a difference of 0.010%), Immigrants from Bosnia and Herzegovina (21.1%, a difference of 0.020%), Czech (21.0%, a difference of 0.10%), British (21.1%, a difference of 0.14%), and Spanish American Indian (21.1%, a difference of 0.17%).
| Demographics | Rating | Rank | Single Female Poverty |
| New Zealanders | 53.2 /100 | #170 | Average 21.0% |
| Moroccans | 52.8 /100 | #171 | Average 21.0% |
| Guyanese | 52.0 /100 | #172 | Average 21.0% |
| Immigrants | Guyana | 50.6 /100 | #173 | Average 21.0% |
| Cubans | 50.0 /100 | #174 | Average 21.0% |
| Czechs | 46.8 /100 | #175 | Average 21.0% |
| Canadians | 45.4 /100 | #176 | Average 21.1% |
| Scandinavians | 45.2 /100 | #177 | Average 21.1% |
| Immigrants | Bosnia and Herzegovina | 44.9 /100 | #178 | Average 21.1% |
| British | 42.9 /100 | #179 | Average 21.1% |
| Spanish American Indians | 42.5 /100 | #180 | Average 21.1% |
| Europeans | 42.3 /100 | #181 | Average 21.1% |
| Slavs | 40.5 /100 | #182 | Average 21.1% |
| Slovaks | 39.7 /100 | #183 | Fair 21.1% |
| Hungarians | 39.6 /100 | #184 | Fair 21.1% |
Demographics Similar to Comanche by Single Female Poverty
In terms of single female poverty, the demographic groups most similar to Comanche are Paiute (25.5%, a difference of 0.11%), Immigrants from Honduras (25.5%, a difference of 0.16%), Cherokee (25.7%, a difference of 0.36%), Central American Indian (25.5%, a difference of 0.44%), and Dominican (25.4%, a difference of 0.59%).
| Demographics | Rating | Rank | Single Female Poverty |
| Immigrants | Mexico | 0.0 /100 | #306 | Tragic 25.3% |
| Potawatomi | 0.0 /100 | #307 | Tragic 25.4% |
| Aleuts | 0.0 /100 | #308 | Tragic 25.4% |
| Dominicans | 0.0 /100 | #309 | Tragic 25.4% |
| Central American Indians | 0.0 /100 | #310 | Tragic 25.5% |
| Immigrants | Honduras | 0.0 /100 | #311 | Tragic 25.5% |
| Paiute | 0.0 /100 | #312 | Tragic 25.5% |
| Comanche | 0.0 /100 | #313 | Tragic 25.6% |
| Cherokee | 0.0 /100 | #314 | Tragic 25.7% |
| Iroquois | 0.0 /100 | #315 | Tragic 25.7% |
| Immigrants | Somalia | 0.0 /100 | #316 | Tragic 25.8% |
| Ottawa | 0.0 /100 | #317 | Tragic 26.0% |
| Chickasaw | 0.0 /100 | #318 | Tragic 26.3% |
| Blacks/African Americans | 0.0 /100 | #319 | Tragic 26.4% |
| Arapaho | 0.0 /100 | #320 | Tragic 26.4% |