Russian vs Bolivian Single Female Poverty
COMPARE
Russian
Bolivian
Single Female Poverty
Single Female Poverty Comparison
Russians
Bolivians
19.2%
SINGLE FEMALE POVERTY
99.6/ 100
METRIC RATING
60th/ 347
METRIC RANK
17.9%
SINGLE FEMALE POVERTY
100.0/ 100
METRIC RATING
14th/ 347
METRIC RANK
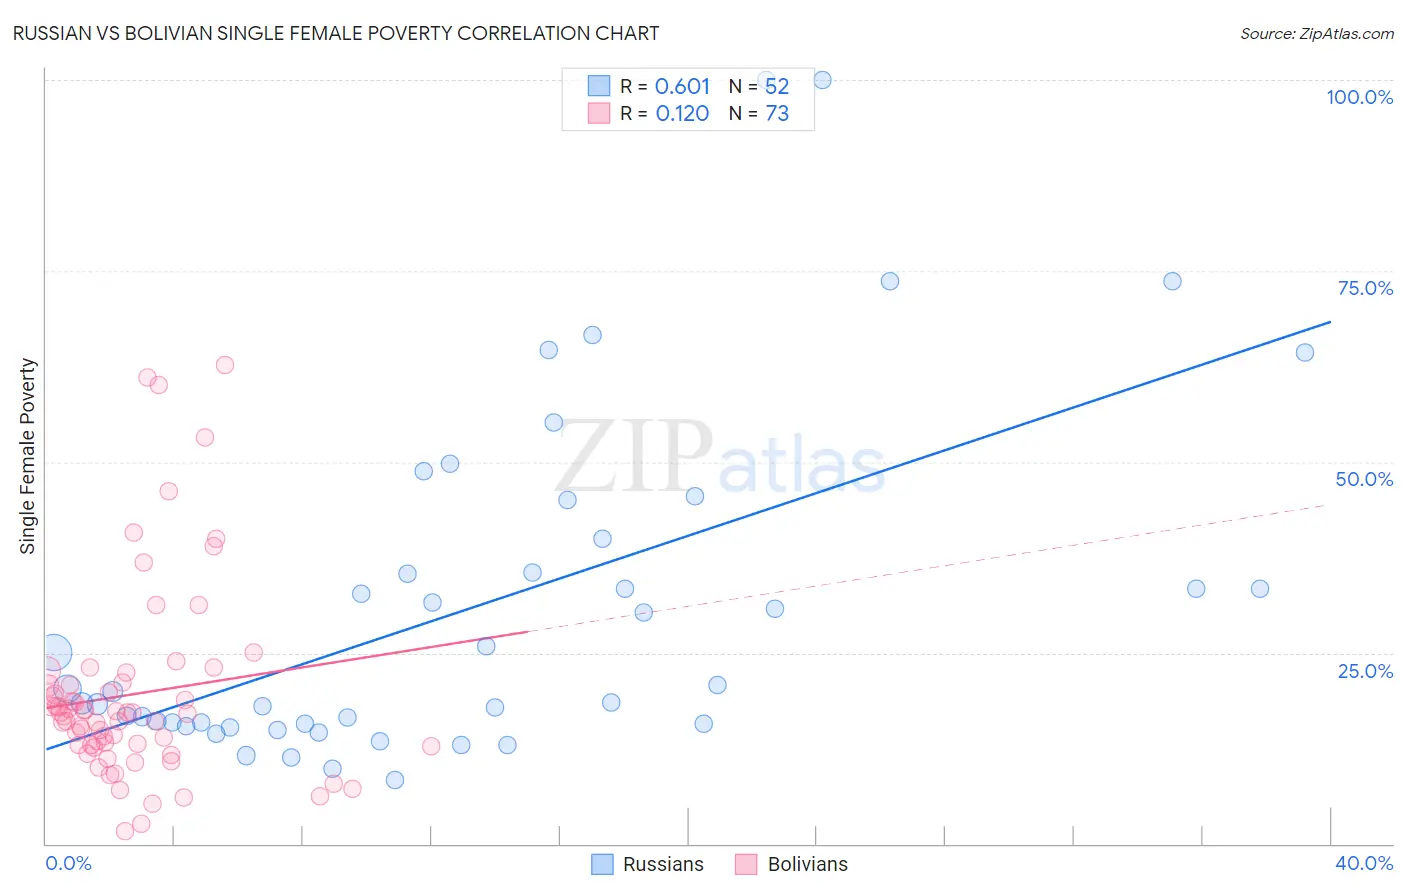
Russian vs Bolivian Single Female Poverty Correlation Chart
The statistical analysis conducted on geographies consisting of 497,545,833 people shows a significant positive correlation between the proportion of Russians and poverty level among single females in the United States with a correlation coefficient (R) of 0.601 and weighted average of 19.2%. Similarly, the statistical analysis conducted on geographies consisting of 183,445,495 people shows a poor positive correlation between the proportion of Bolivians and poverty level among single females in the United States with a correlation coefficient (R) of 0.120 and weighted average of 17.9%, a difference of 7.1%.
Single Female Poverty Correlation Summary
| Measurement | Russian | Bolivian |
| Minimum | 8.3% | 1.6% |
| Maximum | 100.0% | 62.7% |
| Range | 91.7% | 61.1% |
| Mean | 31.0% | 19.6% |
| Median | 20.1% | 17.1% |
| Interquartile 25% (IQ1) | 15.7% | 12.9% |
| Interquartile 75% (IQ3) | 37.8% | 21.0% |
| Interquartile Range (IQR) | 22.1% | 8.1% |
| Standard Deviation (Sample) | 22.3% | 12.8% |
| Standard Deviation (Population) | 22.1% | 12.7% |
Similar Demographics by Single Female Poverty
Demographics Similar to Russians by Single Female Poverty
In terms of single female poverty, the demographic groups most similar to Russians are Cambodian (19.2%, a difference of 0.020%), Lithuanian (19.2%, a difference of 0.070%), Sri Lankan (19.2%, a difference of 0.10%), Immigrants from Northern Europe (19.2%, a difference of 0.19%), and Immigrants from Bulgaria (19.1%, a difference of 0.20%).
| Demographics | Rating | Rank | Single Female Poverty |
| Tsimshian | 99.7 /100 | #53 | Exceptional 19.1% |
| Argentineans | 99.7 /100 | #54 | Exceptional 19.1% |
| Immigrants | Vietnam | 99.7 /100 | #55 | Exceptional 19.1% |
| Immigrants | Fiji | 99.7 /100 | #56 | Exceptional 19.1% |
| Eastern Europeans | 99.7 /100 | #57 | Exceptional 19.1% |
| Immigrants | Bulgaria | 99.7 /100 | #58 | Exceptional 19.1% |
| Sri Lankans | 99.6 /100 | #59 | Exceptional 19.2% |
| Russians | 99.6 /100 | #60 | Exceptional 19.2% |
| Cambodians | 99.6 /100 | #61 | Exceptional 19.2% |
| Lithuanians | 99.6 /100 | #62 | Exceptional 19.2% |
| Immigrants | Northern Europe | 99.6 /100 | #63 | Exceptional 19.2% |
| Immigrants | Europe | 99.6 /100 | #64 | Exceptional 19.2% |
| Cypriots | 99.6 /100 | #65 | Exceptional 19.2% |
| Palestinians | 99.6 /100 | #66 | Exceptional 19.2% |
| Immigrants | Egypt | 99.6 /100 | #67 | Exceptional 19.2% |
Demographics Similar to Bolivians by Single Female Poverty
In terms of single female poverty, the demographic groups most similar to Bolivians are Indian (Asian) (17.9%, a difference of 0.15%), Iranian (18.0%, a difference of 0.30%), Immigrants from Bolivia (17.8%, a difference of 0.44%), Immigrants from South Central Asia (17.8%, a difference of 0.70%), and Immigrants from Lithuania (17.8%, a difference of 0.76%).
| Demographics | Rating | Rank | Single Female Poverty |
| Thais | 100.0 /100 | #7 | Exceptional 17.3% |
| Immigrants | Iran | 100.0 /100 | #8 | Exceptional 17.5% |
| Bhutanese | 100.0 /100 | #9 | Exceptional 17.7% |
| Immigrants | Ireland | 100.0 /100 | #10 | Exceptional 17.8% |
| Immigrants | Lithuania | 100.0 /100 | #11 | Exceptional 17.8% |
| Immigrants | South Central Asia | 100.0 /100 | #12 | Exceptional 17.8% |
| Immigrants | Bolivia | 100.0 /100 | #13 | Exceptional 17.8% |
| Bolivians | 100.0 /100 | #14 | Exceptional 17.9% |
| Indians (Asian) | 100.0 /100 | #15 | Exceptional 17.9% |
| Iranians | 100.0 /100 | #16 | Exceptional 18.0% |
| Immigrants | Korea | 100.0 /100 | #17 | Exceptional 18.1% |
| Immigrants | Eastern Asia | 100.0 /100 | #18 | Exceptional 18.1% |
| Immigrants | China | 100.0 /100 | #19 | Exceptional 18.1% |
| Immigrants | Greece | 100.0 /100 | #20 | Exceptional 18.3% |
| Maltese | 100.0 /100 | #21 | Exceptional 18.3% |