Russian vs Immigrants from Eastern Africa Single Female Poverty
COMPARE
Russian
Immigrants from Eastern Africa
Single Female Poverty
Single Female Poverty Comparison
Russians
Immigrants from Eastern Africa
19.2%
SINGLE FEMALE POVERTY
99.6/ 100
METRIC RATING
60th/ 347
METRIC RANK
21.6%
SINGLE FEMALE POVERTY
15.1/ 100
METRIC RATING
209th/ 347
METRIC RANK
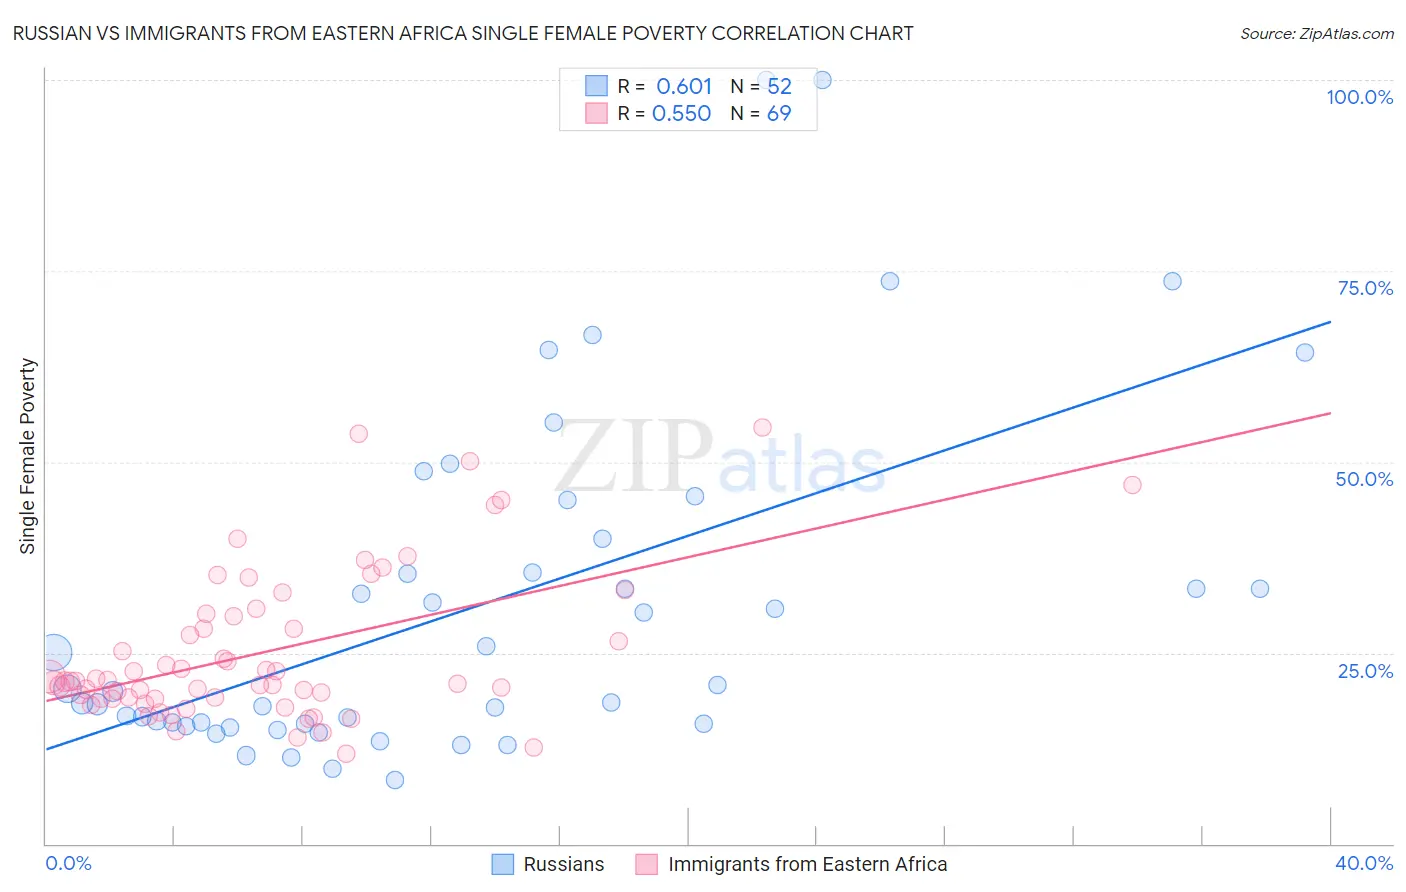
Russian vs Immigrants from Eastern Africa Single Female Poverty Correlation Chart
The statistical analysis conducted on geographies consisting of 497,545,833 people shows a significant positive correlation between the proportion of Russians and poverty level among single females in the United States with a correlation coefficient (R) of 0.601 and weighted average of 19.2%. Similarly, the statistical analysis conducted on geographies consisting of 351,272,292 people shows a substantial positive correlation between the proportion of Immigrants from Eastern Africa and poverty level among single females in the United States with a correlation coefficient (R) of 0.550 and weighted average of 21.6%, a difference of 12.4%.
Single Female Poverty Correlation Summary
| Measurement | Russian | Immigrants from Eastern Africa |
| Minimum | 8.3% | 11.8% |
| Maximum | 100.0% | 54.5% |
| Range | 91.7% | 42.7% |
| Mean | 31.0% | 25.1% |
| Median | 20.1% | 21.3% |
| Interquartile 25% (IQ1) | 15.7% | 19.0% |
| Interquartile 75% (IQ3) | 37.8% | 29.9% |
| Interquartile Range (IQR) | 22.1% | 10.9% |
| Standard Deviation (Sample) | 22.3% | 9.9% |
| Standard Deviation (Population) | 22.1% | 9.8% |
Similar Demographics by Single Female Poverty
Demographics Similar to Russians by Single Female Poverty
In terms of single female poverty, the demographic groups most similar to Russians are Cambodian (19.2%, a difference of 0.020%), Lithuanian (19.2%, a difference of 0.070%), Sri Lankan (19.2%, a difference of 0.10%), Immigrants from Northern Europe (19.2%, a difference of 0.19%), and Immigrants from Bulgaria (19.1%, a difference of 0.20%).
| Demographics | Rating | Rank | Single Female Poverty |
| Tsimshian | 99.7 /100 | #53 | Exceptional 19.1% |
| Argentineans | 99.7 /100 | #54 | Exceptional 19.1% |
| Immigrants | Vietnam | 99.7 /100 | #55 | Exceptional 19.1% |
| Immigrants | Fiji | 99.7 /100 | #56 | Exceptional 19.1% |
| Eastern Europeans | 99.7 /100 | #57 | Exceptional 19.1% |
| Immigrants | Bulgaria | 99.7 /100 | #58 | Exceptional 19.1% |
| Sri Lankans | 99.6 /100 | #59 | Exceptional 19.2% |
| Russians | 99.6 /100 | #60 | Exceptional 19.2% |
| Cambodians | 99.6 /100 | #61 | Exceptional 19.2% |
| Lithuanians | 99.6 /100 | #62 | Exceptional 19.2% |
| Immigrants | Northern Europe | 99.6 /100 | #63 | Exceptional 19.2% |
| Immigrants | Europe | 99.6 /100 | #64 | Exceptional 19.2% |
| Cypriots | 99.6 /100 | #65 | Exceptional 19.2% |
| Palestinians | 99.6 /100 | #66 | Exceptional 19.2% |
| Immigrants | Egypt | 99.6 /100 | #67 | Exceptional 19.2% |
Demographics Similar to Immigrants from Eastern Africa by Single Female Poverty
In terms of single female poverty, the demographic groups most similar to Immigrants from Eastern Africa are Haitian (21.6%, a difference of 0.030%), Ghanaian (21.6%, a difference of 0.070%), Immigrants from Panama (21.6%, a difference of 0.090%), Belgian (21.5%, a difference of 0.11%), and Finnish (21.5%, a difference of 0.12%).
| Demographics | Rating | Rank | Single Female Poverty |
| Immigrants | Kenya | 20.7 /100 | #202 | Fair 21.4% |
| Immigrants | Haiti | 18.8 /100 | #203 | Poor 21.5% |
| Immigrants | Africa | 16.7 /100 | #204 | Poor 21.5% |
| Finns | 16.2 /100 | #205 | Poor 21.5% |
| Belgians | 16.1 /100 | #206 | Poor 21.5% |
| Ghanaians | 15.7 /100 | #207 | Poor 21.6% |
| Haitians | 15.4 /100 | #208 | Poor 21.6% |
| Immigrants | Eastern Africa | 15.1 /100 | #209 | Poor 21.6% |
| Immigrants | Panama | 14.4 /100 | #210 | Poor 21.6% |
| Icelanders | 14.0 /100 | #211 | Poor 21.6% |
| Jamaicans | 14.0 /100 | #212 | Poor 21.6% |
| Guamanians/Chamorros | 13.7 /100 | #213 | Poor 21.6% |
| Immigrants | Nicaragua | 13.3 /100 | #214 | Poor 21.6% |
| Ecuadorians | 12.3 /100 | #215 | Poor 21.6% |
| Immigrants | Barbados | 12.2 /100 | #216 | Poor 21.7% |