Russian vs Turkish Single Female Poverty
COMPARE
Russian
Turkish
Single Female Poverty
Single Female Poverty Comparison
Russians
Turks
19.2%
SINGLE FEMALE POVERTY
99.6/ 100
METRIC RATING
60th/ 347
METRIC RANK
18.7%
SINGLE FEMALE POVERTY
99.9/ 100
METRIC RATING
36th/ 347
METRIC RANK
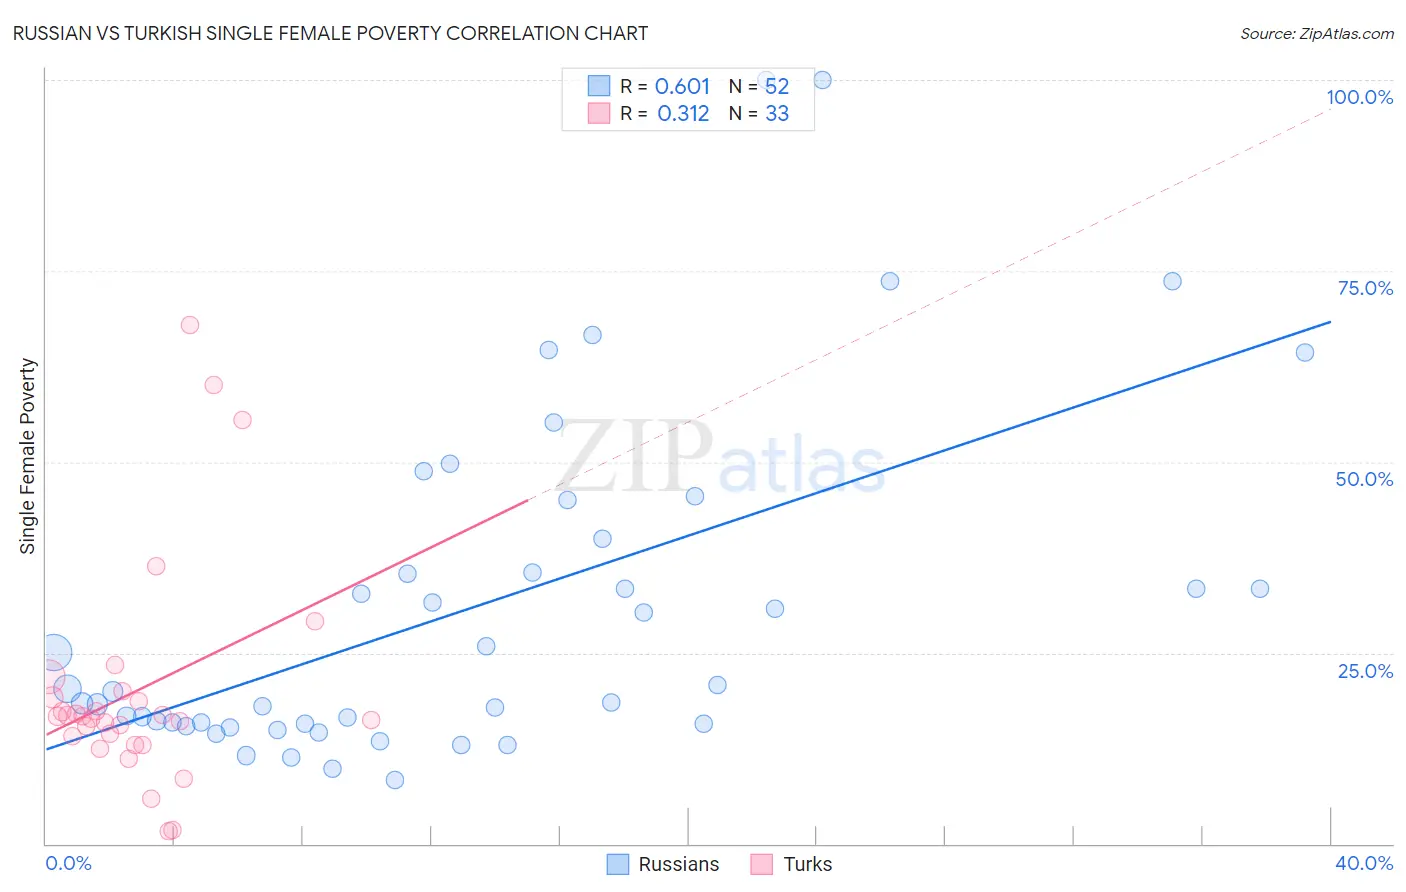
Russian vs Turkish Single Female Poverty Correlation Chart
The statistical analysis conducted on geographies consisting of 497,545,833 people shows a significant positive correlation between the proportion of Russians and poverty level among single females in the United States with a correlation coefficient (R) of 0.601 and weighted average of 19.2%. Similarly, the statistical analysis conducted on geographies consisting of 268,182,441 people shows a mild positive correlation between the proportion of Turks and poverty level among single females in the United States with a correlation coefficient (R) of 0.312 and weighted average of 18.7%, a difference of 2.8%.
Single Female Poverty Correlation Summary
| Measurement | Russian | Turkish |
| Minimum | 8.3% | 1.7% |
| Maximum | 100.0% | 67.9% |
| Range | 91.7% | 66.2% |
| Mean | 31.0% | 20.0% |
| Median | 20.1% | 16.6% |
| Interquartile 25% (IQ1) | 15.7% | 13.5% |
| Interquartile 75% (IQ3) | 37.8% | 19.6% |
| Interquartile Range (IQR) | 22.1% | 6.1% |
| Standard Deviation (Sample) | 22.3% | 14.8% |
| Standard Deviation (Population) | 22.1% | 14.6% |
Similar Demographics by Single Female Poverty
Demographics Similar to Russians by Single Female Poverty
In terms of single female poverty, the demographic groups most similar to Russians are Cambodian (19.2%, a difference of 0.020%), Lithuanian (19.2%, a difference of 0.070%), Sri Lankan (19.2%, a difference of 0.10%), Immigrants from Northern Europe (19.2%, a difference of 0.19%), and Immigrants from Bulgaria (19.1%, a difference of 0.20%).
| Demographics | Rating | Rank | Single Female Poverty |
| Tsimshian | 99.7 /100 | #53 | Exceptional 19.1% |
| Argentineans | 99.7 /100 | #54 | Exceptional 19.1% |
| Immigrants | Vietnam | 99.7 /100 | #55 | Exceptional 19.1% |
| Immigrants | Fiji | 99.7 /100 | #56 | Exceptional 19.1% |
| Eastern Europeans | 99.7 /100 | #57 | Exceptional 19.1% |
| Immigrants | Bulgaria | 99.7 /100 | #58 | Exceptional 19.1% |
| Sri Lankans | 99.6 /100 | #59 | Exceptional 19.2% |
| Russians | 99.6 /100 | #60 | Exceptional 19.2% |
| Cambodians | 99.6 /100 | #61 | Exceptional 19.2% |
| Lithuanians | 99.6 /100 | #62 | Exceptional 19.2% |
| Immigrants | Northern Europe | 99.6 /100 | #63 | Exceptional 19.2% |
| Immigrants | Europe | 99.6 /100 | #64 | Exceptional 19.2% |
| Cypriots | 99.6 /100 | #65 | Exceptional 19.2% |
| Palestinians | 99.6 /100 | #66 | Exceptional 19.2% |
| Immigrants | Egypt | 99.6 /100 | #67 | Exceptional 19.2% |
Demographics Similar to Turks by Single Female Poverty
In terms of single female poverty, the demographic groups most similar to Turks are Immigrants from Armenia (18.7%, a difference of 0.020%), Immigrants from Japan (18.6%, a difference of 0.18%), Korean (18.6%, a difference of 0.24%), Immigrants from Philippines (18.6%, a difference of 0.42%), and Immigrants from Sri Lanka (18.6%, a difference of 0.49%).
| Demographics | Rating | Rank | Single Female Poverty |
| Immigrants | Poland | 100.0 /100 | #29 | Exceptional 18.5% |
| Immigrants | North Macedonia | 99.9 /100 | #30 | Exceptional 18.5% |
| Immigrants | Asia | 99.9 /100 | #31 | Exceptional 18.6% |
| Immigrants | Sri Lanka | 99.9 /100 | #32 | Exceptional 18.6% |
| Immigrants | Philippines | 99.9 /100 | #33 | Exceptional 18.6% |
| Koreans | 99.9 /100 | #34 | Exceptional 18.6% |
| Immigrants | Japan | 99.9 /100 | #35 | Exceptional 18.6% |
| Turks | 99.9 /100 | #36 | Exceptional 18.7% |
| Immigrants | Armenia | 99.9 /100 | #37 | Exceptional 18.7% |
| Tongans | 99.9 /100 | #38 | Exceptional 18.8% |
| Bulgarians | 99.9 /100 | #39 | Exceptional 18.8% |
| Okinawans | 99.9 /100 | #40 | Exceptional 18.8% |
| Immigrants | Serbia | 99.9 /100 | #41 | Exceptional 18.8% |
| Jordanians | 99.9 /100 | #42 | Exceptional 18.8% |
| Immigrants | Romania | 99.9 /100 | #43 | Exceptional 18.8% |