Portuguese vs Immigrants from Romania Single Male Poverty
COMPARE
Portuguese
Immigrants from Romania
Single Male Poverty
Single Male Poverty Comparison
Portuguese
Immigrants from Romania
12.9%
SINGLE MALE POVERTY
30.2/ 100
METRIC RATING
189th/ 347
METRIC RANK
11.7%
SINGLE MALE POVERTY
99.8/ 100
METRIC RATING
57th/ 347
METRIC RANK
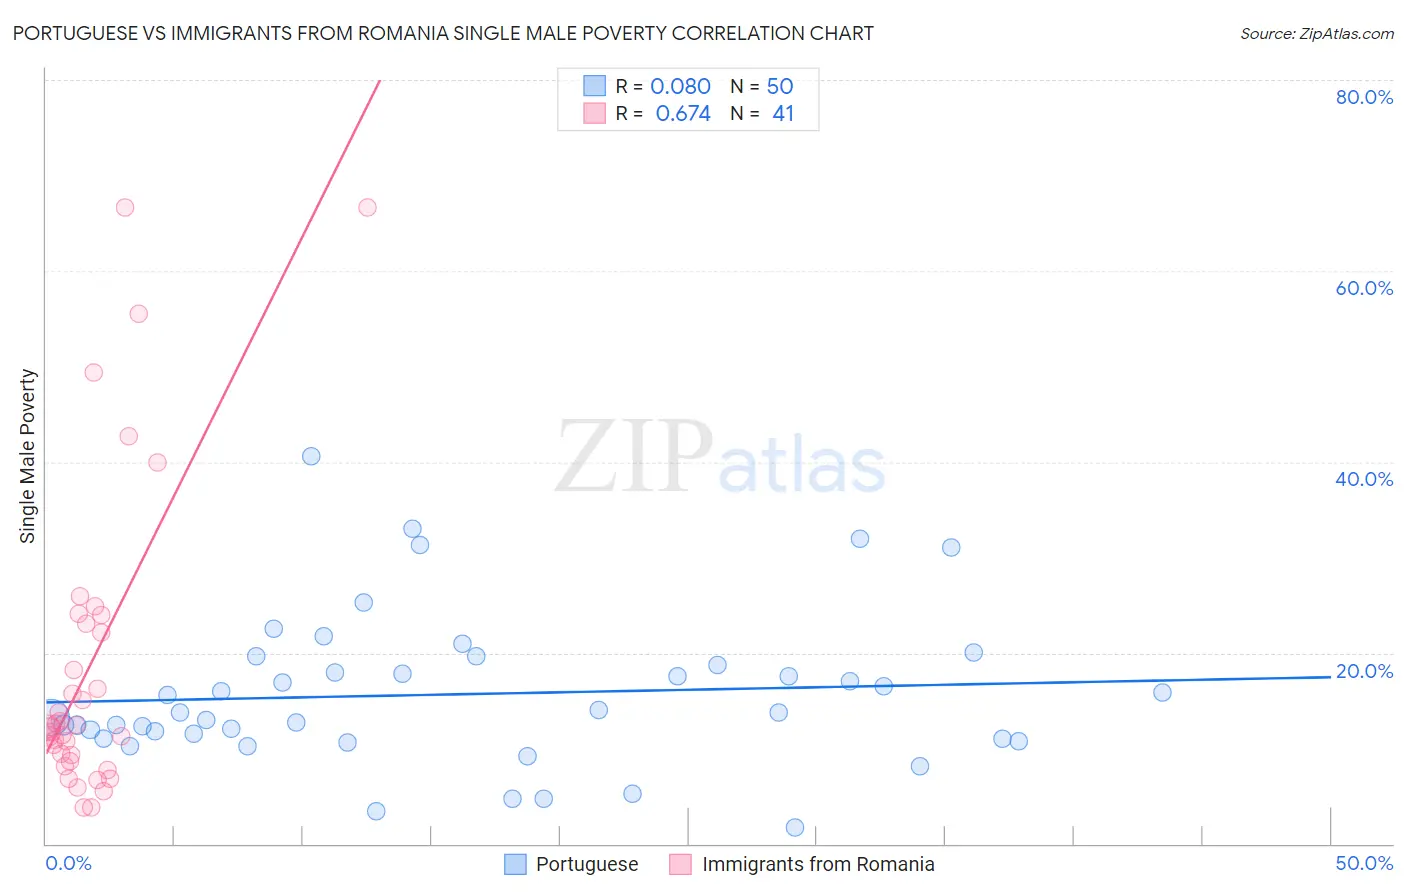
Portuguese vs Immigrants from Romania Single Male Poverty Correlation Chart
The statistical analysis conducted on geographies consisting of 390,984,789 people shows a slight positive correlation between the proportion of Portuguese and poverty level among single males in the United States with a correlation coefficient (R) of 0.080 and weighted average of 12.9%. Similarly, the statistical analysis conducted on geographies consisting of 233,050,167 people shows a significant positive correlation between the proportion of Immigrants from Romania and poverty level among single males in the United States with a correlation coefficient (R) of 0.674 and weighted average of 11.7%, a difference of 10.2%.
Single Male Poverty Correlation Summary
| Measurement | Portuguese | Immigrants from Romania |
| Minimum | 1.7% | 3.8% |
| Maximum | 40.6% | 66.7% |
| Range | 38.8% | 62.9% |
| Mean | 15.7% | 18.7% |
| Median | 13.7% | 12.2% |
| Interquartile 25% (IQ1) | 11.0% | 9.0% |
| Interquartile 75% (IQ3) | 18.7% | 23.5% |
| Interquartile Range (IQR) | 7.7% | 14.5% |
| Standard Deviation (Sample) | 7.9% | 16.2% |
| Standard Deviation (Population) | 7.8% | 16.0% |
Similar Demographics by Single Male Poverty
Demographics Similar to Portuguese by Single Male Poverty
In terms of single male poverty, the demographic groups most similar to Portuguese are Macedonian (12.9%, a difference of 0.080%), Nigerian (12.9%, a difference of 0.10%), Immigrants from Kuwait (12.9%, a difference of 0.10%), Norwegian (12.9%, a difference of 0.11%), and Immigrants from Trinidad and Tobago (12.9%, a difference of 0.14%).
| Demographics | Rating | Rank | Single Male Poverty |
| Moroccans | 36.8 /100 | #182 | Fair 12.9% |
| Immigrants | West Indies | 33.0 /100 | #183 | Fair 12.9% |
| Immigrants | Trinidad and Tobago | 32.5 /100 | #184 | Fair 12.9% |
| Norwegians | 32.0 /100 | #185 | Fair 12.9% |
| Nigerians | 31.9 /100 | #186 | Fair 12.9% |
| Immigrants | Kuwait | 31.9 /100 | #187 | Fair 12.9% |
| Macedonians | 31.5 /100 | #188 | Fair 12.9% |
| Portuguese | 30.2 /100 | #189 | Fair 12.9% |
| Arabs | 27.0 /100 | #190 | Fair 13.0% |
| Immigrants | Thailand | 26.6 /100 | #191 | Fair 13.0% |
| Immigrants | Jamaica | 26.5 /100 | #192 | Fair 13.0% |
| Immigrants | South Africa | 26.1 /100 | #193 | Fair 13.0% |
| Liberians | 25.2 /100 | #194 | Fair 13.0% |
| Immigrants | England | 23.4 /100 | #195 | Fair 13.0% |
| Immigrants | Grenada | 23.1 /100 | #196 | Fair 13.0% |
Demographics Similar to Immigrants from Romania by Single Male Poverty
In terms of single male poverty, the demographic groups most similar to Immigrants from Romania are Immigrants from Brazil (11.7%, a difference of 0.020%), Brazilian (11.8%, a difference of 0.11%), Burmese (11.7%, a difference of 0.15%), Peruvian (11.8%, a difference of 0.32%), and Cambodian (11.8%, a difference of 0.34%).
| Demographics | Rating | Rank | Single Male Poverty |
| Immigrants | Lithuania | 99.9 /100 | #50 | Exceptional 11.6% |
| Paraguayans | 99.9 /100 | #51 | Exceptional 11.6% |
| Samoans | 99.9 /100 | #52 | Exceptional 11.7% |
| Bulgarians | 99.9 /100 | #53 | Exceptional 11.7% |
| Immigrants | Uzbekistan | 99.9 /100 | #54 | Exceptional 11.7% |
| Cypriots | 99.9 /100 | #55 | Exceptional 11.7% |
| Burmese | 99.8 /100 | #56 | Exceptional 11.7% |
| Immigrants | Romania | 99.8 /100 | #57 | Exceptional 11.7% |
| Immigrants | Brazil | 99.8 /100 | #58 | Exceptional 11.7% |
| Brazilians | 99.8 /100 | #59 | Exceptional 11.8% |
| Peruvians | 99.8 /100 | #60 | Exceptional 11.8% |
| Cambodians | 99.8 /100 | #61 | Exceptional 11.8% |
| Immigrants | Sri Lanka | 99.7 /100 | #62 | Exceptional 11.8% |
| Immigrants | Belarus | 99.7 /100 | #63 | Exceptional 11.8% |
| Immigrants | Eastern Europe | 99.6 /100 | #64 | Exceptional 11.8% |