Portuguese vs Immigrants from Romania Unemployment Among Women with Children Under 18 years

COMPARE

Portuguese
Race
Ancestry
AfghanAfricanAlaska NativeAlaskan AthabascanAlbanianAleutAlsatianAmericanApacheArabArapahoArgentineanArmenianAssyrian/Chaldean/SyriacAustralianAustrianBahamianBangladeshiBarbadianBasqueBelgianBelizeanBermudanBhutaneseBlackfeetBolivianBrazilianBritishBritish West IndianBulgarianBurmeseCajunCambodianCanadianCape VerdeanCarpatho RusynCelticCentral AmericanCentral American IndianCherokeeCheyenneChickasawChileanChineseChippewaChoctawColombianColvilleComancheCosta RicanCreeCreekCroatianCrowCubanCypriotCzechCzechoslovakianDanishDelawareDominicanDutchDutch West IndianEastern EuropeanEcuadorianEgyptianEnglishEstonianEthiopianEuropeanFijianFilipinoFinnishFrenchFrench American IndianFrench CanadianGermanGerman RussianGhanaianGreekGuamanian/ChamorroGuatemalanGuyaneseHaitianHmongHonduranHopiHoumaHungarianIcelanderIndian (Asian)IndonesianInupiatIranianIraqiIrishIroquoisIsraeliItalianJamaicanJapaneseJordanianKenyanKiowaKoreanLaotianLatvianLebaneseLiberianLithuanianLumbeeLuxembourgerMacedonianMalaysianMalteseMarshalleseMenomineeMexicanMexican American IndianMongolianMoroccanNative HawaiianNavajoNepaleseNew ZealanderNicaraguanNigerianNorthern EuropeanNorwegianOkinawanOsageOttawaPaiutePakistaniPalestinianPanamanianParaguayanPennsylvania GermanPeruvianPimaPolishPortuguesePotawatomiPuebloPuerto RicanPuget Sound SalishRomanianRussianSalvadoranSamoanScandinavianScotch-IrishScottishSeminoleSenegaleseSerbianShoshoneSierra LeoneanSiouxSlavicSlovakSloveneSomaliSouth AfricanSouth AmericanSouth American IndianSoviet UnionSpaniardSpanishSpanish AmericanSpanish American IndianSri LankanSubsaharan AfricanSudaneseSwedishSwissSyrianTaiwaneseThaiTlingit-HaidaTohono O'OdhamTonganTrinidadian and TobagonianTsimshianTurkishU.S. Virgin IslanderUgandanUkrainianUruguayanUteVenezuelanVietnameseWelshWest IndianYakamaYaquiYugoslavianYumanYup'ikZimbabwean
Immigration
NonimmigrantsImmigrantsAfghanistanAfricaAlbaniaArgentinaArmeniaAsiaAustraliaAustriaBahamasBangladeshBarbadosBelarusBelgiumBelizeBoliviaBosnia and HerzegovinaBrazilBulgariaBurma/MyanmarCabo VerdeCambodiaCameroonCanadaCaribbeanCentral AmericaChileChinaColombiaCongoCosta RicaCroatiaCubaCzechoslovakiaDenmarkDominicaDominican RepublicEastern AfricaEastern AsiaEastern EuropeEcuadorEgyptEl SalvadorEnglandEritreaEthiopiaEuropeFijiFranceGermanyGhanaGreeceGrenadaGuatemalaGuyanaHaitiHondurasHong KongHungaryIndiaIndonesiaIranIraqIrelandIsraelItalyJamaicaJapanJordanKazakhstanKenyaKoreaKuwaitLaosLatin AmericaLatviaLebanonLiberiaLithuaniaMalaysiaMexicoMicronesiaMiddle AfricaMoldovaMoroccoNepalNetherlandsNicaraguaNigeriaNorth AmericaNorth MacedoniaNorthern AfricaNorthern EuropeNorwayOceaniaPakistanPanamaPeruPhilippinesPolandPortugalRussiaSaudi ArabiaScotlandSenegalSerbiaSierra LeoneSingaporeSomaliaSouth AfricaSouth AmericaSouth Central AsiaSouth Eastern AsiaSouthern EuropeSpainSri LankaSt. Vincent and the GrenadinesSudanSwedenSwitzerlandSyriaTaiwanThailandTrinidad and TobagoTurkeyUgandaUkraineUruguayUzbekistanVenezuelaVietnamWest IndiesWestern AfricaWestern AsiaWestern EuropeYemenZaireZimbabweAzores
Immigrants from Romania
Race
Ancestry
AfghanAfricanAlaska NativeAlaskan AthabascanAlbanianAleutAlsatianAmericanApacheArabArapahoArgentineanArmenianAssyrian/Chaldean/SyriacAustralianAustrianBahamianBangladeshiBarbadianBasqueBelgianBelizeanBermudanBhutaneseBlackfeetBolivianBrazilianBritishBritish West IndianBulgarianBurmeseCajunCambodianCanadianCape VerdeanCarpatho RusynCelticCentral AmericanCentral American IndianCherokeeCheyenneChickasawChileanChineseChippewaChoctawColombianColvilleComancheCosta RicanCreeCreekCroatianCrowCubanCypriotCzechCzechoslovakianDanishDelawareDominicanDutchDutch West IndianEastern EuropeanEcuadorianEgyptianEnglishEstonianEthiopianEuropeanFijianFilipinoFinnishFrenchFrench American IndianFrench CanadianGermanGerman RussianGhanaianGreekGuamanian/ChamorroGuatemalanGuyaneseHaitianHmongHonduranHopiHoumaHungarianIcelanderIndian (Asian)IndonesianInupiatIranianIraqiIrishIroquoisIsraeliItalianJamaicanJapaneseJordanianKenyanKiowaKoreanLaotianLatvianLebaneseLiberianLithuanianLumbeeLuxembourgerMacedonianMalaysianMalteseMarshalleseMenomineeMexicanMexican American IndianMongolianMoroccanNative HawaiianNavajoNepaleseNew ZealanderNicaraguanNigerianNorthern EuropeanNorwegianOkinawanOsageOttawaPaiutePakistaniPalestinianPanamanianParaguayanPennsylvania GermanPeruvianPimaPolishPotawatomiPuebloPuerto RicanPuget Sound SalishRomanianRussianSalvadoranSamoanScandinavianScotch-IrishScottishSeminoleSenegaleseSerbianShoshoneSierra LeoneanSiouxSlavicSlovakSloveneSomaliSouth AfricanSouth AmericanSouth American IndianSoviet UnionSpaniardSpanishSpanish AmericanSpanish American IndianSri LankanSubsaharan AfricanSudaneseSwedishSwissSyrianTaiwaneseThaiTlingit-HaidaTohono O'OdhamTonganTrinidadian and TobagonianTsimshianTurkishU.S. Virgin IslanderUgandanUkrainianUruguayanUteVenezuelanVietnameseWelshWest IndianYakamaYaquiYugoslavianYumanYup'ikZimbabwean
Immigration
NonimmigrantsImmigrantsAfghanistanAfricaAlbaniaArgentinaArmeniaAsiaAustraliaAustriaBahamasBangladeshBarbadosBelarusBelgiumBelizeBoliviaBosnia and HerzegovinaBrazilBulgariaBurma/MyanmarCabo VerdeCambodiaCameroonCanadaCaribbeanCentral AmericaChileChinaColombiaCongoCosta RicaCroatiaCubaCzechoslovakiaDenmarkDominicaDominican RepublicEastern AfricaEastern AsiaEastern EuropeEcuadorEgyptEl SalvadorEnglandEritreaEthiopiaEuropeFijiFranceGermanyGhanaGreeceGrenadaGuatemalaGuyanaHaitiHondurasHong KongHungaryIndiaIndonesiaIranIraqIrelandIsraelItalyJamaicaJapanJordanKazakhstanKenyaKoreaKuwaitLaosLatin AmericaLatviaLebanonLiberiaLithuaniaMalaysiaMexicoMicronesiaMiddle AfricaMoldovaMoroccoNepalNetherlandsNicaraguaNigeriaNorth AmericaNorth MacedoniaNorthern AfricaNorthern EuropeNorwayOceaniaPakistanPanamaPeruPhilippinesPolandPortugalRomaniaRussiaSaudi ArabiaScotlandSenegalSerbiaSierra LeoneSingaporeSomaliaSouth AfricaSouth AmericaSouth Central AsiaSouth Eastern AsiaSouthern EuropeSpainSri LankaSt. Vincent and the GrenadinesSudanSwedenSwitzerlandSyriaTaiwanThailandTrinidad and TobagoTurkeyUgandaUkraineUruguayUzbekistanVenezuelaVietnamWest IndiesWestern AfricaWestern AsiaWestern EuropeYemenZaireZimbabweAzores
Unemployment Among Women with Children Under 18 years
Income
Poverty
Unemployment
Labor Participation
Family Structure
Vehicle Availability
Education Level
Disability

Unemployment Among Women with Children Under 18 years Comparison

Portuguese

Immigrants from Romania

Poor
Excellent
5.6%
UNEMPLOYMENT AMONG WOMEN WITH CHILDREN UNDER 18 YEARS
15.9/ 100
METRIC RATING
203rd/ 347
METRIC RANK
5.3%
UNEMPLOYMENT AMONG WOMEN WITH CHILDREN UNDER 18 YEARS
85.8/ 100
METRIC RATING
121st/ 347
METRIC RANK

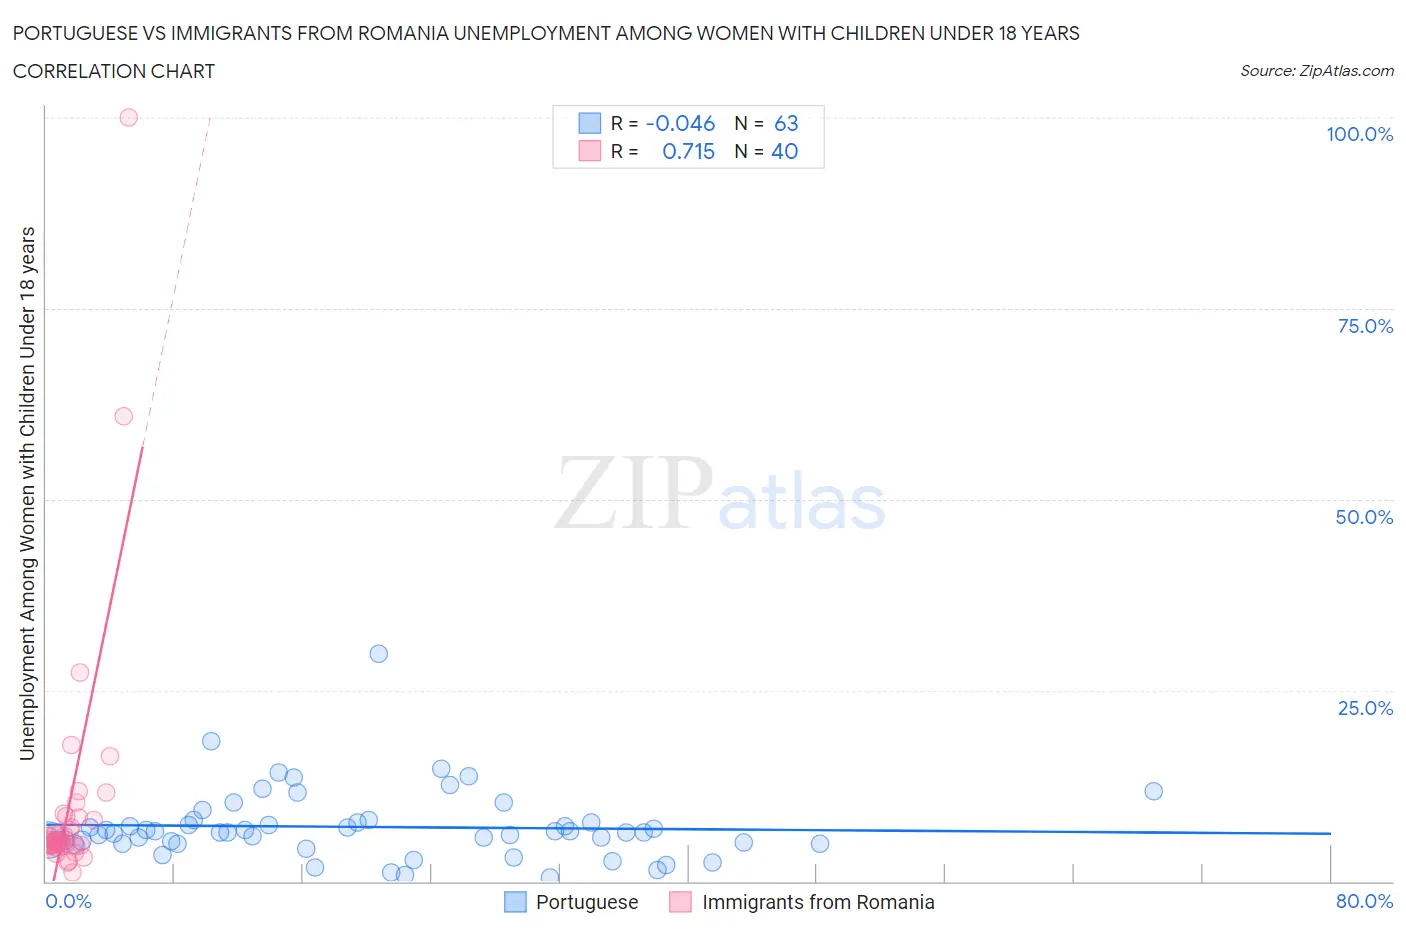
Portuguese vs Immigrants from Romania Unemployment Among Women with Children Under 18 years Correlation Chart

The statistical analysis conducted on geographies consisting of 426,366,108 people shows no correlation between the proportion of Portuguese and unemployment rate among women with children under the age of 18 in the United States with a correlation coefficient (R) of -0.046 and weighted average of 5.6%. Similarly, the statistical analysis conducted on geographies consisting of 251,032,591 people shows a strong positive correlation between the proportion of Immigrants from Romania and unemployment rate among women with children under the age of 18 in the United States with a correlation coefficient (R) of 0.715 and weighted average of 5.3%, a difference of 6.4%.
Portuguese vs Immigrants from Romania Unemployment Among Women with Children Under 18 years

Unemployment Among Women with Children Under 18 years Correlation Summary

MeasurementPortugueseImmigrants from Romania
Minimum0.54%1.2%
Maximum29.7%100.0%
Range29.2%98.8%
Mean7.1%10.6%
Median6.4%5.3%
Interquartile 25% (IQ1)4.9%4.7%
Interquartile 75% (IQ3)7.7%8.5%
Interquartile Range (IQR)2.8%3.8%
Standard Deviation (Sample)4.6%17.5%
Standard Deviation (Population)4.6%17.3%

Similar Demographics by Unemployment Among Women with Children Under 18 years

Demographics Similar to Portuguese by Unemployment Among Women with Children Under 18 years

In terms of unemployment among women with children under 18 years, the demographic groups most similar to Portuguese are Israeli (5.6%, a difference of 0.030%), Tsimshian (5.6%, a difference of 0.080%), Immigrants from Micronesia (5.6%, a difference of 0.15%), Immigrants from Morocco (5.6%, a difference of 0.24%), and Menominee (5.6%, a difference of 0.33%).
DemographicsRating | RankUnemployment Among Women with Children Under 18 years
Spaniards
22.8
/100
|
#196
Fair
5.6%
Immigrants | Colombia
21.4
/100
|
#197
Fair
5.6%
Arabs
21.4
/100
|
#198
Fair
5.6%
Marshallese
20.2
/100
|
#199
Fair
5.6%
Menominee
18.6
/100
|
#200
Poor
5.6%
Immigrants | Morocco
17.9
/100
|
#201
Poor
5.6%
Immigrants | Micronesia
17.1
/100
|
#202
Poor
5.6%
Portuguese
15.9
/100
|
#203
Poor
5.6%
Israelis
15.6
/100
|
#204
Poor
5.6%
Tsimshian
15.2
/100
|
#205
Poor
5.6%
Nicaraguans
12.3
/100
|
#206
Poor
5.6%
Peruvians
12.1
/100
|
#207
Poor
5.6%
Immigrants | Costa Rica
11.6
/100
|
#208
Poor
5.6%
Immigrants | Western Asia
11.3
/100
|
#209
Poor
5.6%
Immigrants | Nonimmigrants
10.6
/100
|
#210
Poor
5.7%

Demographics Similar to Immigrants from Romania by Unemployment Among Women with Children Under 18 years

In terms of unemployment among women with children under 18 years, the demographic groups most similar to Immigrants from Romania are Scotch-Irish (5.3%, a difference of 0.010%), Egyptian (5.3%, a difference of 0.090%), Basque (5.3%, a difference of 0.11%), Immigrants from Europe (5.3%, a difference of 0.15%), and Sudanese (5.3%, a difference of 0.21%).
DemographicsRating | RankUnemployment Among Women with Children Under 18 years
Kenyans
88.2
/100
|
#114
Excellent
5.3%
Hungarians
88.1
/100
|
#115
Excellent
5.3%
Macedonians
87.7
/100
|
#116
Excellent
5.3%
Canadians
87.4
/100
|
#117
Excellent
5.3%
Immigrants | Europe
86.7
/100
|
#118
Excellent
5.3%
Basques
86.5
/100
|
#119
Excellent
5.3%
Egyptians
86.4
/100
|
#120
Excellent
5.3%
Immigrants | Romania
85.8
/100
|
#121
Excellent
5.3%
Scotch-Irish
85.7
/100
|
#122
Excellent
5.3%
Sudanese
84.3
/100
|
#123
Excellent
5.3%
Native Hawaiians
84.0
/100
|
#124
Excellent
5.3%
Immigrants | North Macedonia
83.2
/100
|
#125
Excellent
5.3%
Immigrants | Oceania
83.1
/100
|
#126
Excellent
5.3%
Whites/Caucasians
82.9
/100
|
#127
Excellent
5.3%
Immigrants | South Africa
82.8
/100
|
#128
Excellent
5.3%