Canadian vs Immigrants from Romania Single Male Poverty
COMPARE
Canadian
Immigrants from Romania
Single Male Poverty
Single Male Poverty Comparison
Canadians
Immigrants from Romania
13.3%
SINGLE MALE POVERTY
4.0/ 100
METRIC RATING
234th/ 347
METRIC RANK
11.7%
SINGLE MALE POVERTY
99.8/ 100
METRIC RATING
57th/ 347
METRIC RANK
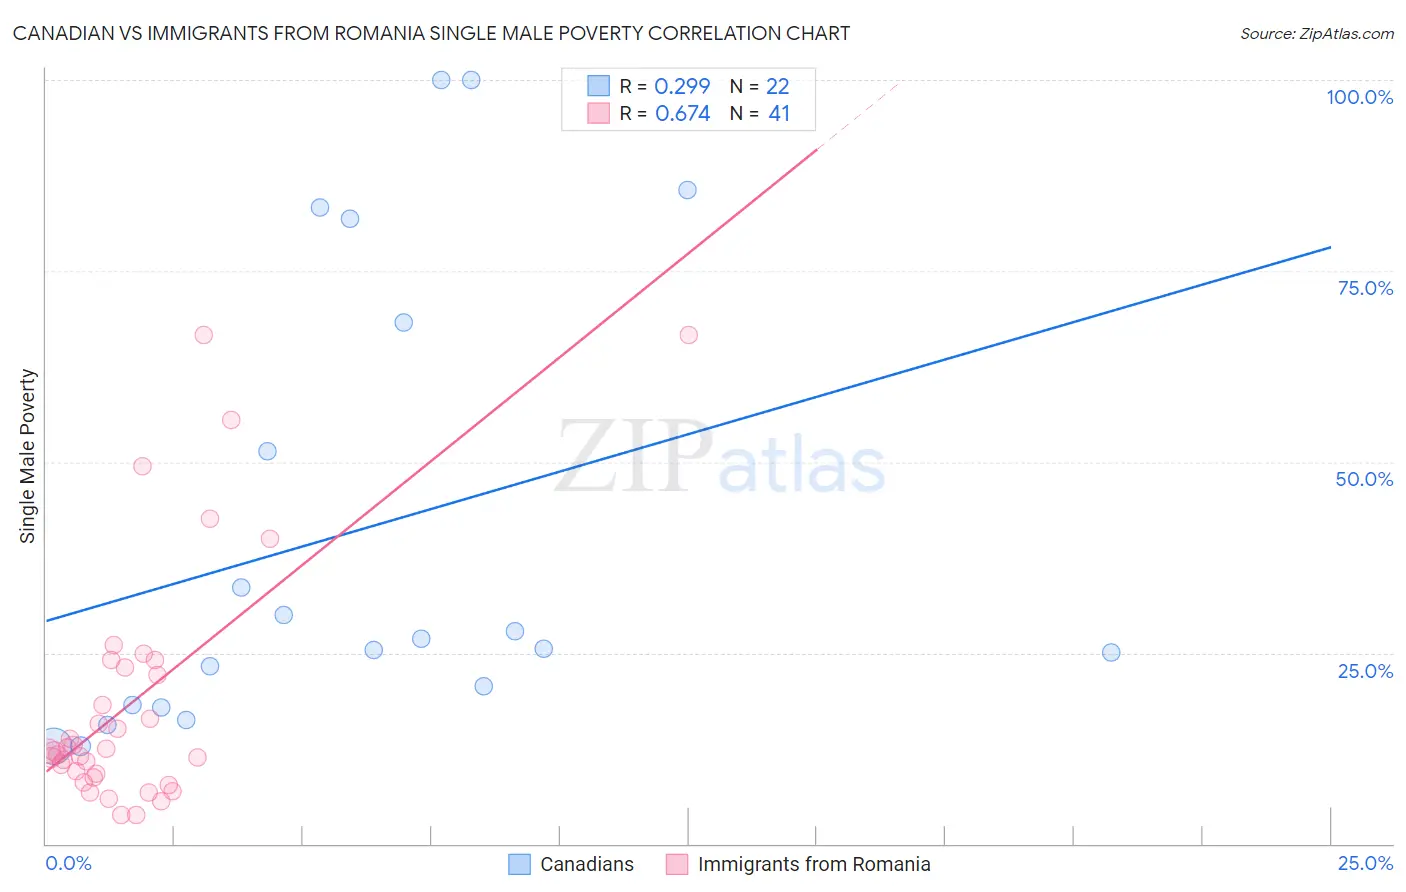
Canadian vs Immigrants from Romania Single Male Poverty Correlation Chart
The statistical analysis conducted on geographies consisting of 379,144,992 people shows a weak positive correlation between the proportion of Canadians and poverty level among single males in the United States with a correlation coefficient (R) of 0.299 and weighted average of 13.3%. Similarly, the statistical analysis conducted on geographies consisting of 233,050,167 people shows a significant positive correlation between the proportion of Immigrants from Romania and poverty level among single males in the United States with a correlation coefficient (R) of 0.674 and weighted average of 11.7%, a difference of 13.6%.
Single Male Poverty Correlation Summary
| Measurement | Canadian | Immigrants from Romania |
| Minimum | 12.8% | 3.8% |
| Maximum | 100.0% | 66.7% |
| Range | 87.2% | 62.9% |
| Mean | 41.0% | 18.7% |
| Median | 26.2% | 12.2% |
| Interquartile 25% (IQ1) | 18.1% | 9.0% |
| Interquartile 75% (IQ3) | 68.3% | 23.5% |
| Interquartile Range (IQR) | 50.1% | 14.5% |
| Standard Deviation (Sample) | 30.2% | 16.2% |
| Standard Deviation (Population) | 29.5% | 16.0% |
Similar Demographics by Single Male Poverty
Demographics Similar to Canadians by Single Male Poverty
In terms of single male poverty, the demographic groups most similar to Canadians are British (13.3%, a difference of 0.0%), Bangladeshi (13.3%, a difference of 0.10%), Luxembourger (13.4%, a difference of 0.15%), British West Indian (13.4%, a difference of 0.21%), and Immigrants from Caribbean (13.3%, a difference of 0.29%).
| Demographics | Rating | Rank | Single Male Poverty |
| Haitians | 7.0 /100 | #227 | Tragic 13.2% |
| Lebanese | 6.6 /100 | #228 | Tragic 13.2% |
| Europeans | 6.2 /100 | #229 | Tragic 13.3% |
| Ghanaians | 6.1 /100 | #230 | Tragic 13.3% |
| Slavs | 5.3 /100 | #231 | Tragic 13.3% |
| Immigrants | Caribbean | 5.0 /100 | #232 | Tragic 13.3% |
| British | 4.0 /100 | #233 | Tragic 13.3% |
| Canadians | 4.0 /100 | #234 | Tragic 13.3% |
| Bangladeshis | 3.7 /100 | #235 | Tragic 13.3% |
| Luxembourgers | 3.6 /100 | #236 | Tragic 13.4% |
| British West Indians | 3.4 /100 | #237 | Tragic 13.4% |
| Immigrants | Ghana | 3.2 /100 | #238 | Tragic 13.4% |
| Czechoslovakians | 3.0 /100 | #239 | Tragic 13.4% |
| Belizeans | 2.3 /100 | #240 | Tragic 13.4% |
| Immigrants | Germany | 2.1 /100 | #241 | Tragic 13.4% |
Demographics Similar to Immigrants from Romania by Single Male Poverty
In terms of single male poverty, the demographic groups most similar to Immigrants from Romania are Immigrants from Brazil (11.7%, a difference of 0.020%), Brazilian (11.8%, a difference of 0.11%), Burmese (11.7%, a difference of 0.15%), Peruvian (11.8%, a difference of 0.32%), and Cambodian (11.8%, a difference of 0.34%).
| Demographics | Rating | Rank | Single Male Poverty |
| Immigrants | Lithuania | 99.9 /100 | #50 | Exceptional 11.6% |
| Paraguayans | 99.9 /100 | #51 | Exceptional 11.6% |
| Samoans | 99.9 /100 | #52 | Exceptional 11.7% |
| Bulgarians | 99.9 /100 | #53 | Exceptional 11.7% |
| Immigrants | Uzbekistan | 99.9 /100 | #54 | Exceptional 11.7% |
| Cypriots | 99.9 /100 | #55 | Exceptional 11.7% |
| Burmese | 99.8 /100 | #56 | Exceptional 11.7% |
| Immigrants | Romania | 99.8 /100 | #57 | Exceptional 11.7% |
| Immigrants | Brazil | 99.8 /100 | #58 | Exceptional 11.7% |
| Brazilians | 99.8 /100 | #59 | Exceptional 11.8% |
| Peruvians | 99.8 /100 | #60 | Exceptional 11.8% |
| Cambodians | 99.8 /100 | #61 | Exceptional 11.8% |
| Immigrants | Sri Lanka | 99.7 /100 | #62 | Exceptional 11.8% |
| Immigrants | Belarus | 99.7 /100 | #63 | Exceptional 11.8% |
| Immigrants | Eastern Europe | 99.6 /100 | #64 | Exceptional 11.8% |