Portuguese vs Ugandan Single Male Poverty
COMPARE
Portuguese
Ugandan
Single Male Poverty
Single Male Poverty Comparison
Portuguese
Ugandans
12.9%
SINGLE MALE POVERTY
30.2/ 100
METRIC RATING
189th/ 347
METRIC RANK
12.3%
SINGLE MALE POVERTY
94.5/ 100
METRIC RATING
109th/ 347
METRIC RANK
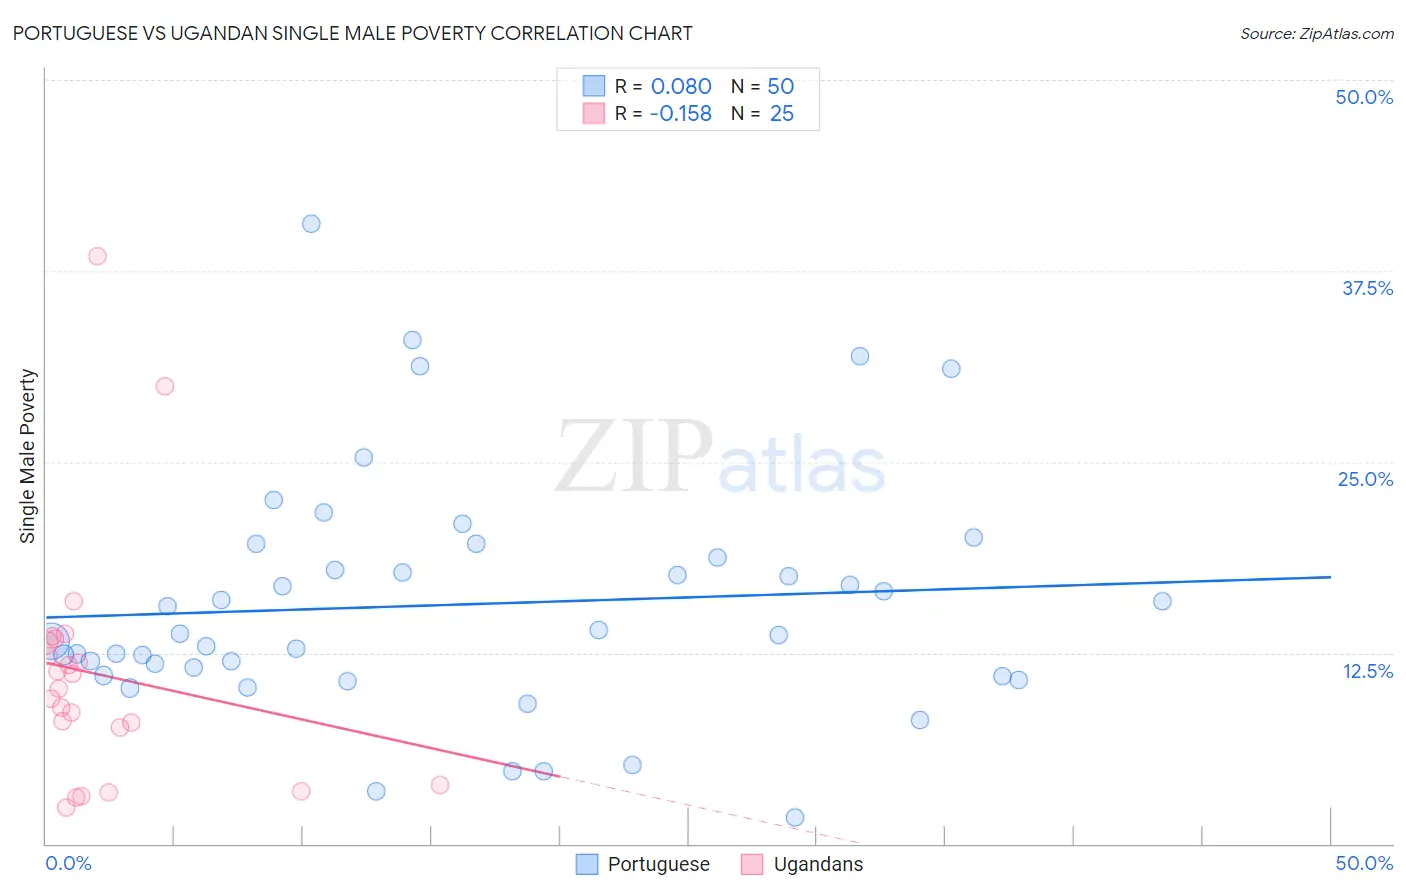
Portuguese vs Ugandan Single Male Poverty Correlation Chart
The statistical analysis conducted on geographies consisting of 390,984,789 people shows a slight positive correlation between the proportion of Portuguese and poverty level among single males in the United States with a correlation coefficient (R) of 0.080 and weighted average of 12.9%. Similarly, the statistical analysis conducted on geographies consisting of 90,762,990 people shows a poor negative correlation between the proportion of Ugandans and poverty level among single males in the United States with a correlation coefficient (R) of -0.158 and weighted average of 12.3%, a difference of 5.0%.
Single Male Poverty Correlation Summary
| Measurement | Portuguese | Ugandan |
| Minimum | 1.7% | 2.3% |
| Maximum | 40.6% | 38.5% |
| Range | 38.8% | 36.1% |
| Mean | 15.7% | 11.1% |
| Median | 13.7% | 10.2% |
| Interquartile 25% (IQ1) | 11.0% | 5.7% |
| Interquartile 75% (IQ3) | 18.7% | 13.3% |
| Interquartile Range (IQR) | 7.7% | 7.5% |
| Standard Deviation (Sample) | 7.9% | 8.1% |
| Standard Deviation (Population) | 7.8% | 7.9% |
Similar Demographics by Single Male Poverty
Demographics Similar to Portuguese by Single Male Poverty
In terms of single male poverty, the demographic groups most similar to Portuguese are Macedonian (12.9%, a difference of 0.080%), Nigerian (12.9%, a difference of 0.10%), Immigrants from Kuwait (12.9%, a difference of 0.10%), Norwegian (12.9%, a difference of 0.11%), and Immigrants from Trinidad and Tobago (12.9%, a difference of 0.14%).
| Demographics | Rating | Rank | Single Male Poverty |
| Moroccans | 36.8 /100 | #182 | Fair 12.9% |
| Immigrants | West Indies | 33.0 /100 | #183 | Fair 12.9% |
| Immigrants | Trinidad and Tobago | 32.5 /100 | #184 | Fair 12.9% |
| Norwegians | 32.0 /100 | #185 | Fair 12.9% |
| Nigerians | 31.9 /100 | #186 | Fair 12.9% |
| Immigrants | Kuwait | 31.9 /100 | #187 | Fair 12.9% |
| Macedonians | 31.5 /100 | #188 | Fair 12.9% |
| Portuguese | 30.2 /100 | #189 | Fair 12.9% |
| Arabs | 27.0 /100 | #190 | Fair 13.0% |
| Immigrants | Thailand | 26.6 /100 | #191 | Fair 13.0% |
| Immigrants | Jamaica | 26.5 /100 | #192 | Fair 13.0% |
| Immigrants | South Africa | 26.1 /100 | #193 | Fair 13.0% |
| Liberians | 25.2 /100 | #194 | Fair 13.0% |
| Immigrants | England | 23.4 /100 | #195 | Fair 13.0% |
| Immigrants | Grenada | 23.1 /100 | #196 | Fair 13.0% |
Demographics Similar to Ugandans by Single Male Poverty
In terms of single male poverty, the demographic groups most similar to Ugandans are Immigrants from Eastern Africa (12.3%, a difference of 0.13%), Iraqi (12.3%, a difference of 0.15%), Immigrants from Portugal (12.3%, a difference of 0.23%), Immigrants from North Macedonia (12.3%, a difference of 0.24%), and Kenyan (12.4%, a difference of 0.30%).
| Demographics | Rating | Rank | Single Male Poverty |
| Immigrants | Europe | 97.0 /100 | #102 | Exceptional 12.2% |
| Immigrants | Armenia | 96.7 /100 | #103 | Exceptional 12.2% |
| Immigrants | Kazakhstan | 96.7 /100 | #104 | Exceptional 12.2% |
| Jordanians | 95.9 /100 | #105 | Exceptional 12.3% |
| Immigrants | Morocco | 95.6 /100 | #106 | Exceptional 12.3% |
| Iraqis | 95.1 /100 | #107 | Exceptional 12.3% |
| Immigrants | Eastern Africa | 95.0 /100 | #108 | Exceptional 12.3% |
| Ugandans | 94.5 /100 | #109 | Exceptional 12.3% |
| Immigrants | Portugal | 93.6 /100 | #110 | Exceptional 12.3% |
| Immigrants | North Macedonia | 93.6 /100 | #111 | Exceptional 12.3% |
| Kenyans | 93.3 /100 | #112 | Exceptional 12.4% |
| Pakistanis | 92.4 /100 | #113 | Exceptional 12.4% |
| Nicaraguans | 92.1 /100 | #114 | Exceptional 12.4% |
| Immigrants | Southern Europe | 91.5 /100 | #115 | Exceptional 12.4% |
| Immigrants | Syria | 91.2 /100 | #116 | Exceptional 12.4% |