Pima vs Immigrants from Western Africa Family Poverty
COMPARE
Pima
Immigrants from Western Africa
Family Poverty
Family Poverty Comparison
Pima
Immigrants from Western Africa
18.4%
FAMILY POVERTY
0.0/ 100
METRIC RATING
343rd/ 347
METRIC RANK
10.7%
FAMILY POVERTY
0.3/ 100
METRIC RATING
253rd/ 347
METRIC RANK
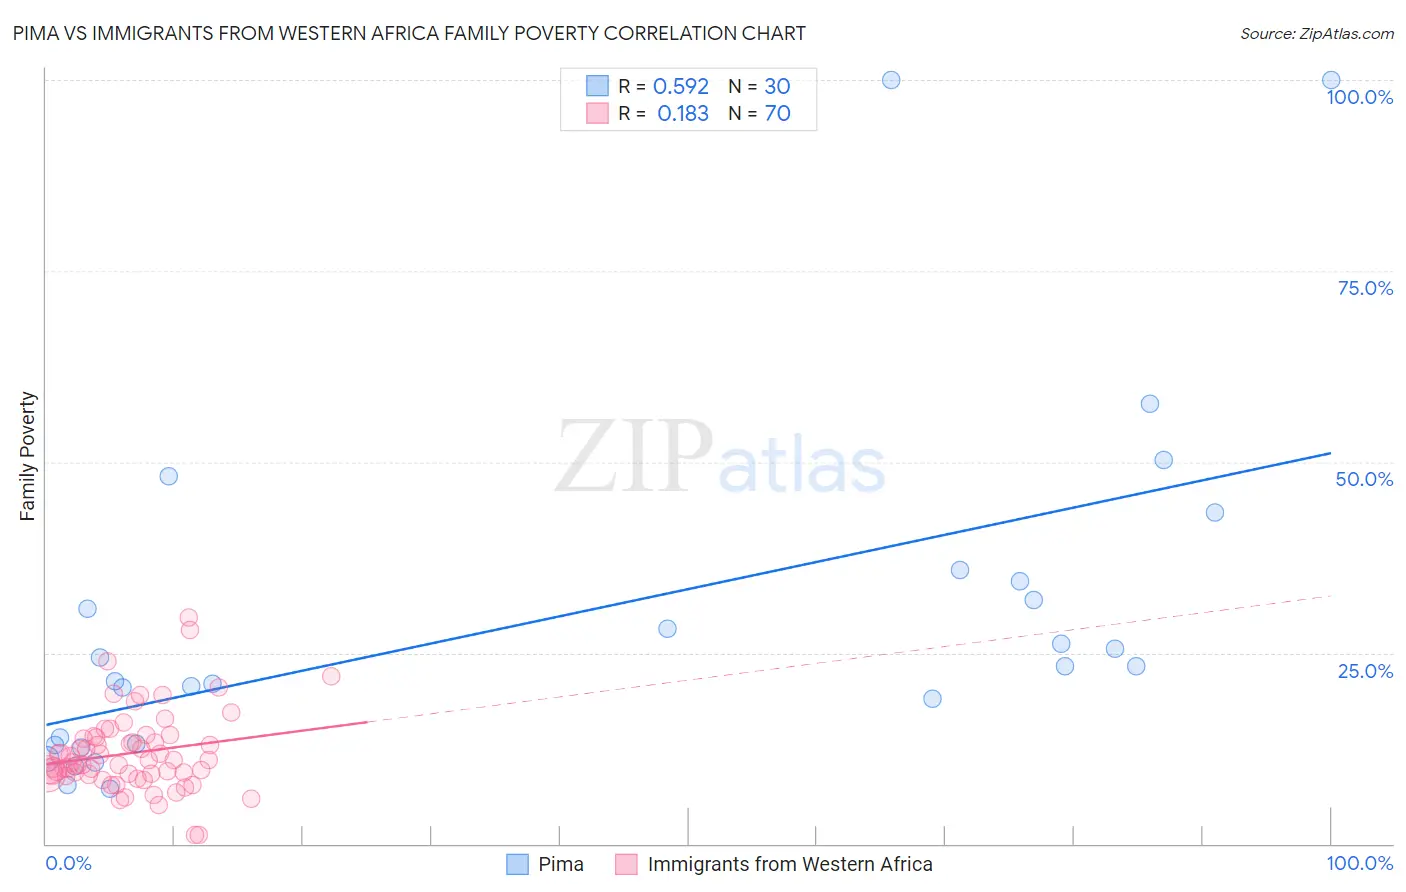
Pima vs Immigrants from Western Africa Family Poverty Correlation Chart
The statistical analysis conducted on geographies consisting of 61,531,194 people shows a substantial positive correlation between the proportion of Pima and poverty level among families in the United States with a correlation coefficient (R) of 0.592 and weighted average of 18.4%. Similarly, the statistical analysis conducted on geographies consisting of 357,059,325 people shows a poor positive correlation between the proportion of Immigrants from Western Africa and poverty level among families in the United States with a correlation coefficient (R) of 0.183 and weighted average of 10.7%, a difference of 70.9%.
Family Poverty Correlation Summary
| Measurement | Pima | Immigrants from Western Africa |
| Minimum | 7.2% | 1.2% |
| Maximum | 100.0% | 29.6% |
| Range | 92.8% | 28.4% |
| Mean | 29.5% | 11.9% |
| Median | 23.3% | 10.8% |
| Interquartile 25% (IQ1) | 13.0% | 9.1% |
| Interquartile 75% (IQ3) | 34.4% | 13.9% |
| Interquartile Range (IQR) | 21.4% | 4.8% |
| Standard Deviation (Sample) | 23.1% | 5.2% |
| Standard Deviation (Population) | 22.7% | 5.2% |
Similar Demographics by Family Poverty
Demographics Similar to Pima by Family Poverty
In terms of family poverty, the demographic groups most similar to Pima are Yup'ik (18.7%, a difference of 1.8%), Navajo (18.8%, a difference of 2.4%), Immigrants from Yemen (17.5%, a difference of 5.1%), Lumbee (17.0%, a difference of 8.0%), and Pueblo (17.0%, a difference of 8.1%).
| Demographics | Rating | Rank | Family Poverty |
| Immigrants | Dominican Republic | 0.0 /100 | #333 | Tragic 14.4% |
| Houma | 0.0 /100 | #334 | Tragic 14.6% |
| Apache | 0.0 /100 | #335 | Tragic 14.7% |
| Sioux | 0.0 /100 | #336 | Tragic 15.9% |
| Hopi | 0.0 /100 | #337 | Tragic 15.9% |
| Crow | 0.0 /100 | #338 | Tragic 16.1% |
| Yuman | 0.0 /100 | #339 | Tragic 16.6% |
| Pueblo | 0.0 /100 | #340 | Tragic 17.0% |
| Lumbee | 0.0 /100 | #341 | Tragic 17.0% |
| Immigrants | Yemen | 0.0 /100 | #342 | Tragic 17.5% |
| Pima | 0.0 /100 | #343 | Tragic 18.4% |
| Yup'ik | 0.0 /100 | #344 | Tragic 18.7% |
| Navajo | 0.0 /100 | #345 | Tragic 18.8% |
| Puerto Ricans | 0.0 /100 | #346 | Tragic 20.3% |
| Tohono O'odham | 0.0 /100 | #347 | Tragic 20.4% |
Demographics Similar to Immigrants from Western Africa by Family Poverty
In terms of family poverty, the demographic groups most similar to Immigrants from Western Africa are Immigrants from Zaire (10.7%, a difference of 0.11%), Iroquois (10.7%, a difference of 0.23%), Ecuadorian (10.8%, a difference of 0.30%), Salvadoran (10.7%, a difference of 0.51%), and Immigrants from Liberia (10.8%, a difference of 0.68%).
| Demographics | Rating | Rank | Family Poverty |
| Cherokee | 0.5 /100 | #246 | Tragic 10.6% |
| Liberians | 0.4 /100 | #247 | Tragic 10.6% |
| Nicaraguans | 0.4 /100 | #248 | Tragic 10.6% |
| Cubans | 0.4 /100 | #249 | Tragic 10.6% |
| Salvadorans | 0.3 /100 | #250 | Tragic 10.7% |
| Iroquois | 0.3 /100 | #251 | Tragic 10.7% |
| Immigrants | Zaire | 0.3 /100 | #252 | Tragic 10.7% |
| Immigrants | Western Africa | 0.3 /100 | #253 | Tragic 10.7% |
| Ecuadorians | 0.2 /100 | #254 | Tragic 10.8% |
| Immigrants | Liberia | 0.2 /100 | #255 | Tragic 10.8% |
| Chickasaw | 0.2 /100 | #256 | Tragic 10.8% |
| Immigrants | Ghana | 0.2 /100 | #257 | Tragic 10.8% |
| Sub-Saharan Africans | 0.2 /100 | #258 | Tragic 10.9% |
| Mexican American Indians | 0.2 /100 | #259 | Tragic 10.9% |
| Bangladeshis | 0.2 /100 | #260 | Tragic 10.9% |