Jordanian vs Immigrants from Western Africa Family Poverty
COMPARE
Jordanian
Immigrants from Western Africa
Family Poverty
Family Poverty Comparison
Jordanians
Immigrants from Western Africa
8.2%
FAMILY POVERTY
94.8/ 100
METRIC RATING
109th/ 347
METRIC RANK
10.7%
FAMILY POVERTY
0.3/ 100
METRIC RATING
253rd/ 347
METRIC RANK
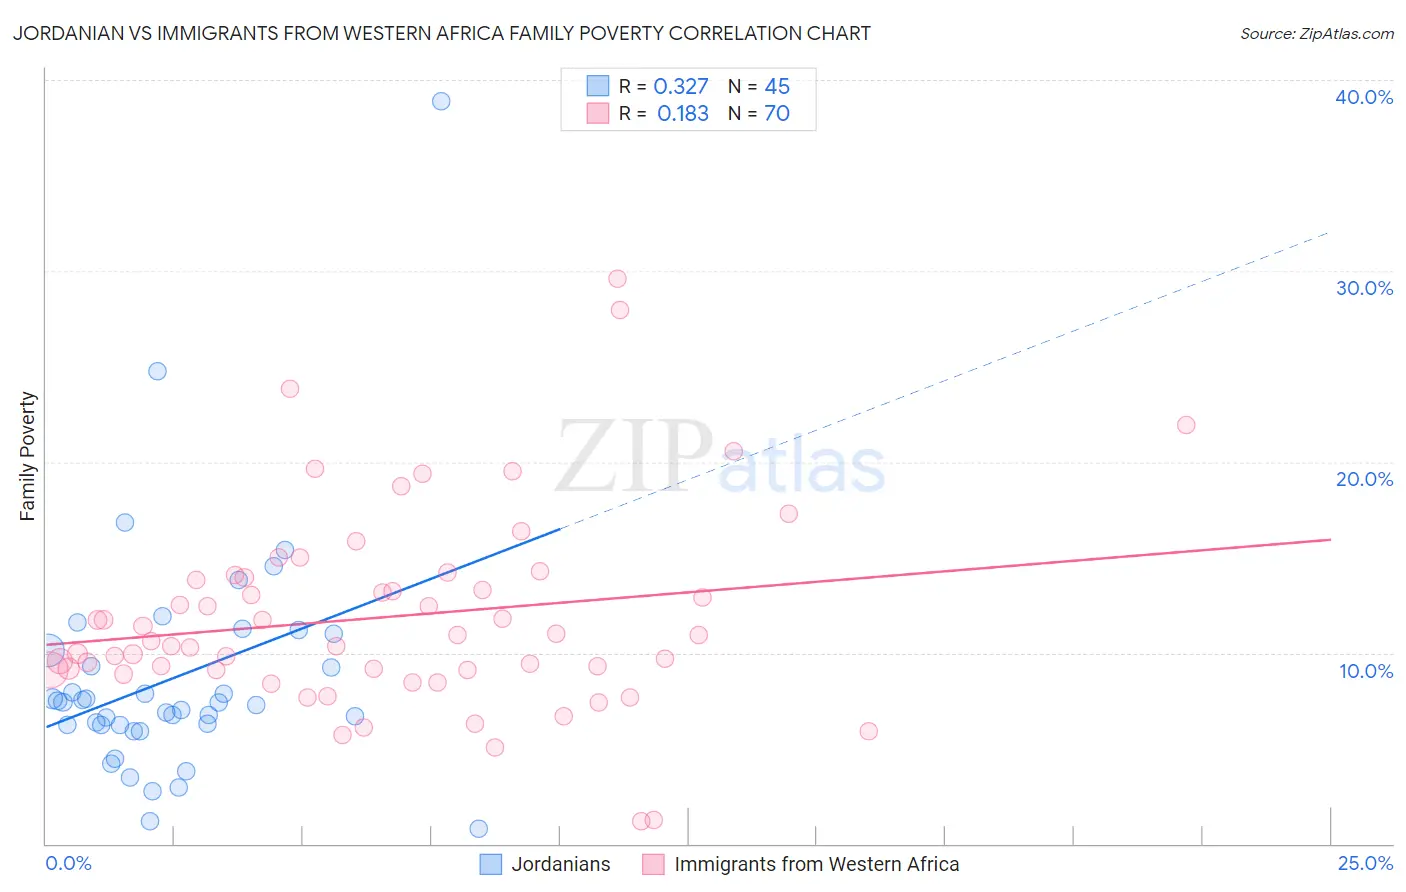
Jordanian vs Immigrants from Western Africa Family Poverty Correlation Chart
The statistical analysis conducted on geographies consisting of 166,331,422 people shows a mild positive correlation between the proportion of Jordanians and poverty level among families in the United States with a correlation coefficient (R) of 0.327 and weighted average of 8.2%. Similarly, the statistical analysis conducted on geographies consisting of 357,059,325 people shows a poor positive correlation between the proportion of Immigrants from Western Africa and poverty level among families in the United States with a correlation coefficient (R) of 0.183 and weighted average of 10.7%, a difference of 31.8%.
Family Poverty Correlation Summary
| Measurement | Jordanian | Immigrants from Western Africa |
| Minimum | 0.81% | 1.2% |
| Maximum | 38.9% | 29.6% |
| Range | 38.1% | 28.4% |
| Mean | 8.7% | 11.9% |
| Median | 7.4% | 10.8% |
| Interquartile 25% (IQ1) | 6.2% | 9.1% |
| Interquartile 75% (IQ3) | 10.6% | 13.9% |
| Interquartile Range (IQR) | 4.3% | 4.8% |
| Standard Deviation (Sample) | 6.3% | 5.2% |
| Standard Deviation (Population) | 6.2% | 5.2% |
Similar Demographics by Family Poverty
Demographics Similar to Jordanians by Family Poverty
In terms of family poverty, the demographic groups most similar to Jordanians are Basque (8.1%, a difference of 0.090%), Romanian (8.2%, a difference of 0.090%), Taiwanese (8.2%, a difference of 0.15%), French Canadian (8.1%, a difference of 0.18%), and Egyptian (8.1%, a difference of 0.22%).
| Demographics | Rating | Rank | Family Poverty |
| Immigrants | Indonesia | 95.7 /100 | #102 | Exceptional 8.1% |
| Immigrants | Eastern Europe | 95.6 /100 | #103 | Exceptional 8.1% |
| Slavs | 95.6 /100 | #104 | Exceptional 8.1% |
| Laotians | 95.6 /100 | #105 | Exceptional 8.1% |
| Egyptians | 95.1 /100 | #106 | Exceptional 8.1% |
| French Canadians | 95.0 /100 | #107 | Exceptional 8.1% |
| Basques | 94.9 /100 | #108 | Exceptional 8.1% |
| Jordanians | 94.8 /100 | #109 | Exceptional 8.2% |
| Romanians | 94.7 /100 | #110 | Exceptional 8.2% |
| Taiwanese | 94.6 /100 | #111 | Exceptional 8.2% |
| Immigrants | France | 94.4 /100 | #112 | Exceptional 8.2% |
| Canadians | 94.2 /100 | #113 | Exceptional 8.2% |
| Immigrants | Zimbabwe | 94.0 /100 | #114 | Exceptional 8.2% |
| Immigrants | Israel | 93.5 /100 | #115 | Exceptional 8.2% |
| South Africans | 93.4 /100 | #116 | Exceptional 8.2% |
Demographics Similar to Immigrants from Western Africa by Family Poverty
In terms of family poverty, the demographic groups most similar to Immigrants from Western Africa are Immigrants from Zaire (10.7%, a difference of 0.11%), Iroquois (10.7%, a difference of 0.23%), Ecuadorian (10.8%, a difference of 0.30%), Salvadoran (10.7%, a difference of 0.51%), and Immigrants from Liberia (10.8%, a difference of 0.68%).
| Demographics | Rating | Rank | Family Poverty |
| Cherokee | 0.5 /100 | #246 | Tragic 10.6% |
| Liberians | 0.4 /100 | #247 | Tragic 10.6% |
| Nicaraguans | 0.4 /100 | #248 | Tragic 10.6% |
| Cubans | 0.4 /100 | #249 | Tragic 10.6% |
| Salvadorans | 0.3 /100 | #250 | Tragic 10.7% |
| Iroquois | 0.3 /100 | #251 | Tragic 10.7% |
| Immigrants | Zaire | 0.3 /100 | #252 | Tragic 10.7% |
| Immigrants | Western Africa | 0.3 /100 | #253 | Tragic 10.7% |
| Ecuadorians | 0.2 /100 | #254 | Tragic 10.8% |
| Immigrants | Liberia | 0.2 /100 | #255 | Tragic 10.8% |
| Chickasaw | 0.2 /100 | #256 | Tragic 10.8% |
| Immigrants | Ghana | 0.2 /100 | #257 | Tragic 10.8% |
| Sub-Saharan Africans | 0.2 /100 | #258 | Tragic 10.9% |
| Mexican American Indians | 0.2 /100 | #259 | Tragic 10.9% |
| Bangladeshis | 0.2 /100 | #260 | Tragic 10.9% |