Paraguayan vs Immigrants from Sudan Poverty
COMPARE
Paraguayan
Immigrants from Sudan
Poverty
Poverty Comparison
Paraguayans
Immigrants from Sudan
11.4%
POVERTY
94.9/ 100
METRIC RATING
94th/ 347
METRIC RANK
14.1%
POVERTY
0.3/ 100
METRIC RATING
245th/ 347
METRIC RANK
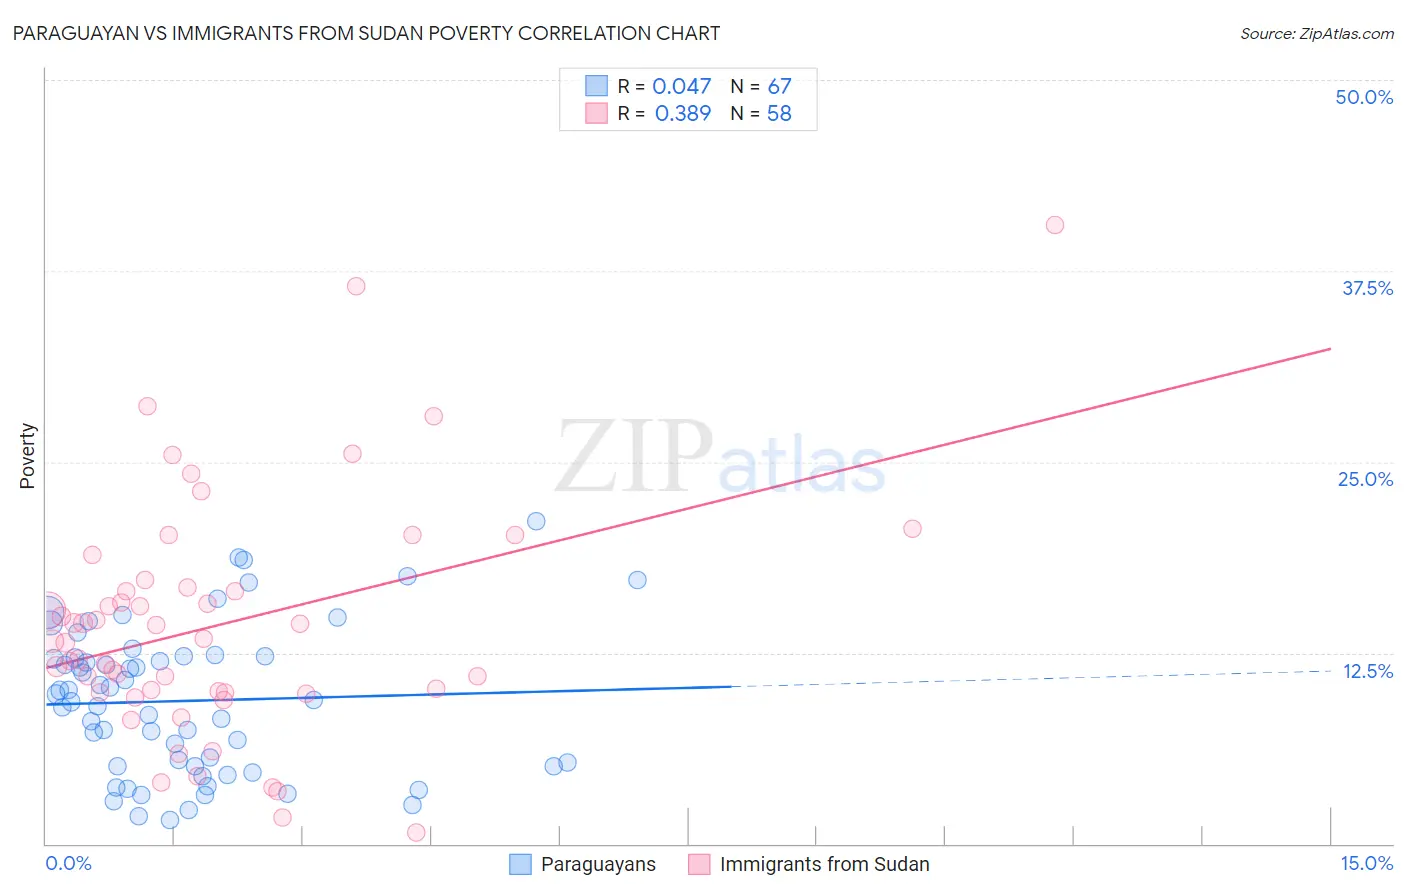
Paraguayan vs Immigrants from Sudan Poverty Correlation Chart
The statistical analysis conducted on geographies consisting of 95,102,151 people shows no correlation between the proportion of Paraguayans and poverty level in the United States with a correlation coefficient (R) of 0.047 and weighted average of 11.4%. Similarly, the statistical analysis conducted on geographies consisting of 118,962,035 people shows a mild positive correlation between the proportion of Immigrants from Sudan and poverty level in the United States with a correlation coefficient (R) of 0.389 and weighted average of 14.1%, a difference of 23.0%.
Poverty Correlation Summary
| Measurement | Paraguayan | Immigrants from Sudan |
| Minimum | 1.5% | 0.75% |
| Maximum | 21.1% | 40.5% |
| Range | 19.6% | 39.8% |
| Mean | 9.4% | 14.3% |
| Median | 9.4% | 13.4% |
| Interquartile 25% (IQ1) | 5.1% | 9.9% |
| Interquartile 75% (IQ3) | 12.2% | 16.8% |
| Interquartile Range (IQR) | 7.2% | 6.9% |
| Standard Deviation (Sample) | 4.8% | 7.8% |
| Standard Deviation (Population) | 4.8% | 7.7% |
Similar Demographics by Poverty
Demographics Similar to Paraguayans by Poverty
In terms of poverty, the demographic groups most similar to Paraguayans are Australian (11.4%, a difference of 0.0%), Romanian (11.4%, a difference of 0.020%), British (11.4%, a difference of 0.060%), Immigrants from South Africa (11.5%, a difference of 0.12%), and Immigrants from Egypt (11.5%, a difference of 0.16%).
| Demographics | Rating | Rank | Poverty |
| Northern Europeans | 96.0 /100 | #87 | Exceptional 11.4% |
| Belgians | 95.8 /100 | #88 | Exceptional 11.4% |
| Czechoslovakians | 95.7 /100 | #89 | Exceptional 11.4% |
| Immigrants | Denmark | 95.5 /100 | #90 | Exceptional 11.4% |
| Finns | 95.2 /100 | #91 | Exceptional 11.4% |
| British | 95.0 /100 | #92 | Exceptional 11.4% |
| Romanians | 94.9 /100 | #93 | Exceptional 11.4% |
| Paraguayans | 94.9 /100 | #94 | Exceptional 11.4% |
| Australians | 94.9 /100 | #95 | Exceptional 11.4% |
| Immigrants | South Africa | 94.7 /100 | #96 | Exceptional 11.5% |
| Immigrants | Egypt | 94.6 /100 | #97 | Exceptional 11.5% |
| Immigrants | Latvia | 94.5 /100 | #98 | Exceptional 11.5% |
| Immigrants | Indonesia | 94.2 /100 | #99 | Exceptional 11.5% |
| Scottish | 94.0 /100 | #100 | Exceptional 11.5% |
| Slavs | 93.3 /100 | #101 | Exceptional 11.5% |
Demographics Similar to Immigrants from Sudan by Poverty
In terms of poverty, the demographic groups most similar to Immigrants from Sudan are Potawatomi (14.1%, a difference of 0.20%), Nepalese (14.0%, a difference of 0.39%), Sudanese (14.0%, a difference of 0.42%), Liberian (14.1%, a difference of 0.48%), and Ecuadorian (14.0%, a difference of 0.49%).
| Demographics | Rating | Rank | Poverty |
| Ghanaians | 0.5 /100 | #238 | Tragic 13.9% |
| Nicaraguans | 0.4 /100 | #239 | Tragic 13.9% |
| Immigrants | Middle Africa | 0.4 /100 | #240 | Tragic 14.0% |
| Salvadorans | 0.4 /100 | #241 | Tragic 14.0% |
| Ecuadorians | 0.4 /100 | #242 | Tragic 14.0% |
| Sudanese | 0.3 /100 | #243 | Tragic 14.0% |
| Nepalese | 0.3 /100 | #244 | Tragic 14.0% |
| Immigrants | Sudan | 0.3 /100 | #245 | Tragic 14.1% |
| Potawatomi | 0.3 /100 | #246 | Tragic 14.1% |
| Liberians | 0.2 /100 | #247 | Tragic 14.1% |
| Immigrants | Western Africa | 0.2 /100 | #248 | Tragic 14.1% |
| Immigrants | Ghana | 0.2 /100 | #249 | Tragic 14.2% |
| Cree | 0.2 /100 | #250 | Tragic 14.2% |
| Immigrants | Burma/Myanmar | 0.2 /100 | #251 | Tragic 14.2% |
| Spanish American Indians | 0.2 /100 | #252 | Tragic 14.2% |