Paraguayan vs Immigrants from Sudan Family Poverty
COMPARE
Paraguayan
Immigrants from Sudan
Family Poverty
Family Poverty Comparison
Paraguayans
Immigrants from Sudan
8.3%
FAMILY POVERTY
91.2/ 100
METRIC RATING
122nd/ 347
METRIC RANK
10.1%
FAMILY POVERTY
2.3/ 100
METRIC RATING
232nd/ 347
METRIC RANK
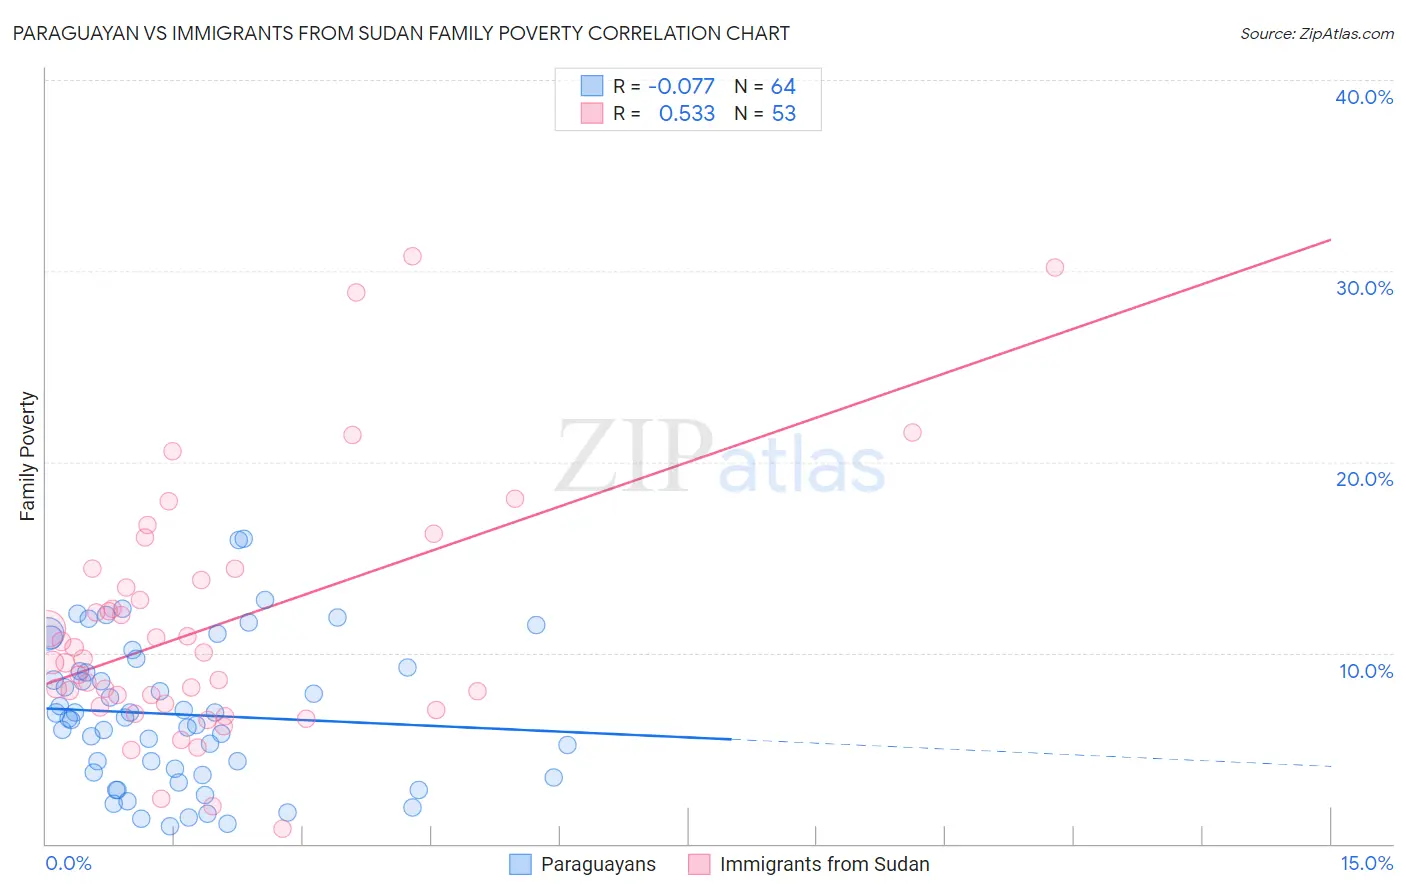
Paraguayan vs Immigrants from Sudan Family Poverty Correlation Chart
The statistical analysis conducted on geographies consisting of 95,035,993 people shows a slight negative correlation between the proportion of Paraguayans and poverty level among families in the United States with a correlation coefficient (R) of -0.077 and weighted average of 8.3%. Similarly, the statistical analysis conducted on geographies consisting of 118,923,711 people shows a substantial positive correlation between the proportion of Immigrants from Sudan and poverty level among families in the United States with a correlation coefficient (R) of 0.533 and weighted average of 10.1%, a difference of 21.5%.
Family Poverty Correlation Summary
| Measurement | Paraguayan | Immigrants from Sudan |
| Minimum | 0.93% | 0.80% |
| Maximum | 16.0% | 30.8% |
| Range | 15.0% | 30.0% |
| Mean | 6.8% | 11.4% |
| Median | 6.6% | 9.7% |
| Interquartile 25% (IQ1) | 3.6% | 7.3% |
| Interquartile 75% (IQ3) | 9.1% | 14.1% |
| Interquartile Range (IQR) | 5.5% | 6.9% |
| Standard Deviation (Sample) | 3.7% | 6.5% |
| Standard Deviation (Population) | 3.7% | 6.4% |
Similar Demographics by Family Poverty
Demographics Similar to Paraguayans by Family Poverty
In terms of family poverty, the demographic groups most similar to Paraguayans are Native Hawaiian (8.3%, a difference of 0.010%), Palestinian (8.3%, a difference of 0.070%), Soviet Union (8.3%, a difference of 0.17%), Immigrants from Egypt (8.3%, a difference of 0.18%), and Pakistani (8.3%, a difference of 0.21%).
| Demographics | Rating | Rank | Family Poverty |
| Immigrants | Israel | 93.5 /100 | #115 | Exceptional 8.2% |
| South Africans | 93.4 /100 | #116 | Exceptional 8.2% |
| Immigrants | Russia | 93.2 /100 | #117 | Exceptional 8.2% |
| Immigrants | Western Europe | 92.9 /100 | #118 | Exceptional 8.2% |
| French | 92.8 /100 | #119 | Exceptional 8.3% |
| Immigrants | Egypt | 91.6 /100 | #120 | Exceptional 8.3% |
| Native Hawaiians | 91.3 /100 | #121 | Exceptional 8.3% |
| Paraguayans | 91.2 /100 | #122 | Exceptional 8.3% |
| Palestinians | 91.1 /100 | #123 | Exceptional 8.3% |
| Soviet Union | 90.8 /100 | #124 | Exceptional 8.3% |
| Pakistanis | 90.8 /100 | #125 | Exceptional 8.3% |
| Icelanders | 90.3 /100 | #126 | Exceptional 8.3% |
| Immigrants | Hungary | 89.9 /100 | #127 | Excellent 8.4% |
| Argentineans | 89.6 /100 | #128 | Excellent 8.4% |
| Portuguese | 89.2 /100 | #129 | Excellent 8.4% |
Demographics Similar to Immigrants from Sudan by Family Poverty
In terms of family poverty, the demographic groups most similar to Immigrants from Sudan are Fijian (10.1%, a difference of 0.25%), Immigrants from Middle Africa (10.1%, a difference of 0.36%), Nigerian (10.1%, a difference of 0.39%), Alaskan Athabascan (10.1%, a difference of 0.43%), and Immigrants from Nigeria (10.2%, a difference of 0.64%).
| Demographics | Rating | Rank | Family Poverty |
| Immigrants | Immigrants | 3.6 /100 | #225 | Tragic 10.0% |
| Ottawa | 3.3 /100 | #226 | Tragic 10.0% |
| Immigrants | Armenia | 3.3 /100 | #227 | Tragic 10.0% |
| Sudanese | 3.1 /100 | #228 | Tragic 10.0% |
| Immigrants | Uzbekistan | 3.1 /100 | #229 | Tragic 10.0% |
| Immigrants | Panama | 3.1 /100 | #230 | Tragic 10.0% |
| Alaskan Athabascans | 2.7 /100 | #231 | Tragic 10.1% |
| Immigrants | Sudan | 2.3 /100 | #232 | Tragic 10.1% |
| Fijians | 2.1 /100 | #233 | Tragic 10.1% |
| Immigrants | Middle Africa | 2.1 /100 | #234 | Tragic 10.1% |
| Nigerians | 2.0 /100 | #235 | Tragic 10.1% |
| Immigrants | Nigeria | 1.9 /100 | #236 | Tragic 10.2% |
| Immigrants | Laos | 1.7 /100 | #237 | Tragic 10.2% |
| French American Indians | 1.5 /100 | #238 | Tragic 10.2% |
| Potawatomi | 1.5 /100 | #239 | Tragic 10.2% |