Panamanian vs Pima Single Female Poverty
COMPARE
Panamanian
Pima
Single Female Poverty
Single Female Poverty Comparison
Panamanians
Pima
21.7%
SINGLE FEMALE POVERTY
9.4/ 100
METRIC RATING
219th/ 347
METRIC RANK
30.3%
SINGLE FEMALE POVERTY
0.0/ 100
METRIC RATING
338th/ 347
METRIC RANK
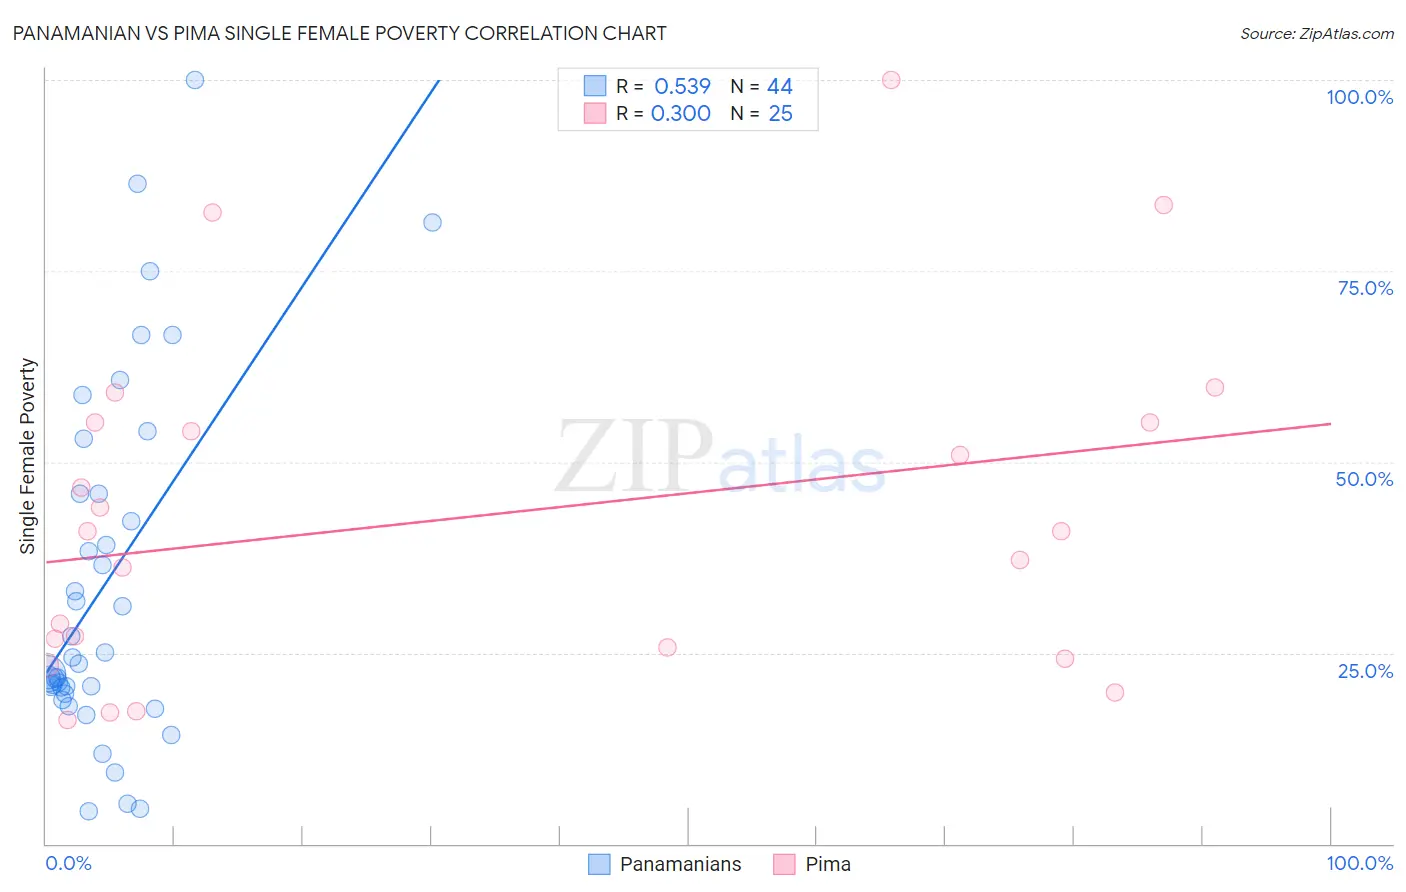
Panamanian vs Pima Single Female Poverty Correlation Chart
The statistical analysis conducted on geographies consisting of 278,926,833 people shows a substantial positive correlation between the proportion of Panamanians and poverty level among single females in the United States with a correlation coefficient (R) of 0.539 and weighted average of 21.7%. Similarly, the statistical analysis conducted on geographies consisting of 61,414,275 people shows a mild positive correlation between the proportion of Pima and poverty level among single females in the United States with a correlation coefficient (R) of 0.300 and weighted average of 30.3%, a difference of 39.5%.
Single Female Poverty Correlation Summary
| Measurement | Panamanian | Pima |
| Minimum | 4.3% | 16.1% |
| Maximum | 100.0% | 100.0% |
| Range | 95.7% | 83.9% |
| Mean | 34.1% | 42.9% |
| Median | 24.0% | 41.0% |
| Interquartile 25% (IQ1) | 20.0% | 24.9% |
| Interquartile 75% (IQ3) | 45.9% | 55.1% |
| Interquartile Range (IQR) | 25.8% | 30.2% |
| Standard Deviation (Sample) | 23.1% | 22.3% |
| Standard Deviation (Population) | 22.8% | 21.8% |
Similar Demographics by Single Female Poverty
Demographics Similar to Panamanians by Single Female Poverty
In terms of single female poverty, the demographic groups most similar to Panamanians are Nepalese (21.7%, a difference of 0.050%), German (21.8%, a difference of 0.21%), Immigrants from Grenada (21.8%, a difference of 0.26%), Immigrants from Eritrea (21.8%, a difference of 0.27%), and Immigrants from St. Vincent and the Grenadines (21.7%, a difference of 0.38%).
| Demographics | Rating | Rank | Single Female Poverty |
| Jamaicans | 14.0 /100 | #212 | Poor 21.6% |
| Guamanians/Chamorros | 13.7 /100 | #213 | Poor 21.6% |
| Immigrants | Nicaragua | 13.3 /100 | #214 | Poor 21.6% |
| Ecuadorians | 12.3 /100 | #215 | Poor 21.6% |
| Immigrants | Barbados | 12.2 /100 | #216 | Poor 21.7% |
| Immigrants | St. Vincent and the Grenadines | 11.7 /100 | #217 | Poor 21.7% |
| Nepalese | 9.7 /100 | #218 | Tragic 21.7% |
| Panamanians | 9.4 /100 | #219 | Tragic 21.7% |
| Germans | 8.3 /100 | #220 | Tragic 21.8% |
| Immigrants | Grenada | 8.0 /100 | #221 | Tragic 21.8% |
| Immigrants | Eritrea | 7.9 /100 | #222 | Tragic 21.8% |
| Scottish | 7.3 /100 | #223 | Tragic 21.8% |
| Barbadians | 7.2 /100 | #224 | Tragic 21.8% |
| English | 6.4 /100 | #225 | Tragic 21.9% |
| Immigrants | Portugal | 5.8 /100 | #226 | Tragic 21.9% |
Demographics Similar to Pima by Single Female Poverty
In terms of single female poverty, the demographic groups most similar to Pima are Cheyenne (30.4%, a difference of 0.22%), Cajun (30.6%, a difference of 1.0%), Yuman (29.4%, a difference of 3.0%), Sioux (31.3%, a difference of 3.0%), and Colville (29.1%, a difference of 4.3%).
| Demographics | Rating | Rank | Single Female Poverty |
| Natives/Alaskans | 0.0 /100 | #331 | Tragic 28.2% |
| Yakama | 0.0 /100 | #332 | Tragic 28.3% |
| Ute | 0.0 /100 | #333 | Tragic 28.4% |
| Pueblo | 0.0 /100 | #334 | Tragic 28.6% |
| Immigrants | Yemen | 0.0 /100 | #335 | Tragic 28.9% |
| Colville | 0.0 /100 | #336 | Tragic 29.1% |
| Yuman | 0.0 /100 | #337 | Tragic 29.4% |
| Pima | 0.0 /100 | #338 | Tragic 30.3% |
| Cheyenne | 0.0 /100 | #339 | Tragic 30.4% |
| Cajuns | 0.0 /100 | #340 | Tragic 30.6% |
| Sioux | 0.0 /100 | #341 | Tragic 31.3% |
| Navajo | 0.0 /100 | #342 | Tragic 31.7% |
| Crow | 0.0 /100 | #343 | Tragic 32.4% |
| Lumbee | 0.0 /100 | #344 | Tragic 33.0% |
| Houma | 0.0 /100 | #345 | Tragic 33.8% |