Panamanian vs Colombian Single Female Poverty
COMPARE
Panamanian
Colombian
Single Female Poverty
Single Female Poverty Comparison
Panamanians
Colombians
21.7%
SINGLE FEMALE POVERTY
9.4/ 100
METRIC RATING
219th/ 347
METRIC RANK
19.9%
SINGLE FEMALE POVERTY
96.6/ 100
METRIC RATING
109th/ 347
METRIC RANK
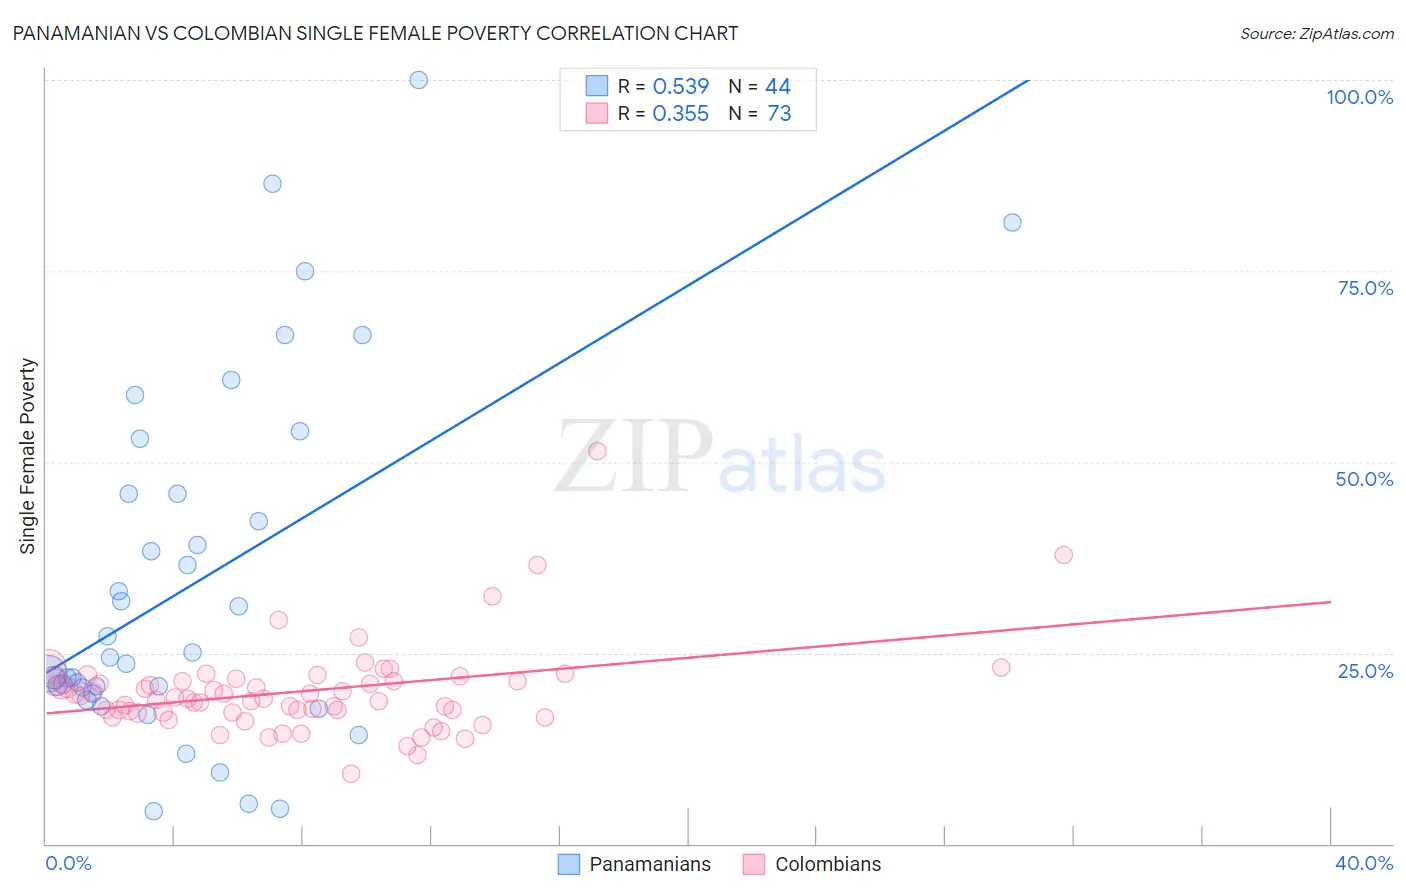
Panamanian vs Colombian Single Female Poverty Correlation Chart
The statistical analysis conducted on geographies consisting of 278,926,833 people shows a substantial positive correlation between the proportion of Panamanians and poverty level among single females in the United States with a correlation coefficient (R) of 0.539 and weighted average of 21.7%. Similarly, the statistical analysis conducted on geographies consisting of 412,800,850 people shows a mild positive correlation between the proportion of Colombians and poverty level among single females in the United States with a correlation coefficient (R) of 0.355 and weighted average of 19.9%, a difference of 9.2%.
Single Female Poverty Correlation Summary
| Measurement | Panamanian | Colombian |
| Minimum | 4.3% | 9.2% |
| Maximum | 100.0% | 51.3% |
| Range | 95.7% | 42.2% |
| Mean | 34.1% | 19.9% |
| Median | 24.0% | 19.0% |
| Interquartile 25% (IQ1) | 20.0% | 17.2% |
| Interquartile 75% (IQ3) | 45.9% | 21.3% |
| Interquartile Range (IQR) | 25.8% | 4.1% |
| Standard Deviation (Sample) | 23.1% | 6.0% |
| Standard Deviation (Population) | 22.8% | 6.0% |
Similar Demographics by Single Female Poverty
Demographics Similar to Panamanians by Single Female Poverty
In terms of single female poverty, the demographic groups most similar to Panamanians are Nepalese (21.7%, a difference of 0.050%), German (21.8%, a difference of 0.21%), Immigrants from Grenada (21.8%, a difference of 0.26%), Immigrants from Eritrea (21.8%, a difference of 0.27%), and Immigrants from St. Vincent and the Grenadines (21.7%, a difference of 0.38%).
| Demographics | Rating | Rank | Single Female Poverty |
| Jamaicans | 14.0 /100 | #212 | Poor 21.6% |
| Guamanians/Chamorros | 13.7 /100 | #213 | Poor 21.6% |
| Immigrants | Nicaragua | 13.3 /100 | #214 | Poor 21.6% |
| Ecuadorians | 12.3 /100 | #215 | Poor 21.6% |
| Immigrants | Barbados | 12.2 /100 | #216 | Poor 21.7% |
| Immigrants | St. Vincent and the Grenadines | 11.7 /100 | #217 | Poor 21.7% |
| Nepalese | 9.7 /100 | #218 | Tragic 21.7% |
| Panamanians | 9.4 /100 | #219 | Tragic 21.7% |
| Germans | 8.3 /100 | #220 | Tragic 21.8% |
| Immigrants | Grenada | 8.0 /100 | #221 | Tragic 21.8% |
| Immigrants | Eritrea | 7.9 /100 | #222 | Tragic 21.8% |
| Scottish | 7.3 /100 | #223 | Tragic 21.8% |
| Barbadians | 7.2 /100 | #224 | Tragic 21.8% |
| English | 6.4 /100 | #225 | Tragic 21.9% |
| Immigrants | Portugal | 5.8 /100 | #226 | Tragic 21.9% |
Demographics Similar to Colombians by Single Female Poverty
In terms of single female poverty, the demographic groups most similar to Colombians are Native Hawaiian (19.9%, a difference of 0.0%), Immigrants from Western Asia (19.9%, a difference of 0.010%), Immigrants from Syria (19.9%, a difference of 0.060%), Ethiopian (19.9%, a difference of 0.070%), and Israeli (19.9%, a difference of 0.17%).
| Demographics | Rating | Rank | Single Female Poverty |
| Immigrants | Cameroon | 97.3 /100 | #102 | Exceptional 19.8% |
| Immigrants | Southern Europe | 97.1 /100 | #103 | Exceptional 19.9% |
| Chileans | 96.9 /100 | #104 | Exceptional 19.9% |
| Israelis | 96.9 /100 | #105 | Exceptional 19.9% |
| Ethiopians | 96.7 /100 | #106 | Exceptional 19.9% |
| Immigrants | Syria | 96.7 /100 | #107 | Exceptional 19.9% |
| Native Hawaiians | 96.6 /100 | #108 | Exceptional 19.9% |
| Colombians | 96.6 /100 | #109 | Exceptional 19.9% |
| Immigrants | Western Asia | 96.5 /100 | #110 | Exceptional 19.9% |
| Carpatho Rusyns | 96.1 /100 | #111 | Exceptional 20.0% |
| Immigrants | Netherlands | 96.0 /100 | #112 | Exceptional 20.0% |
| Immigrants | Zimbabwe | 95.9 /100 | #113 | Exceptional 20.0% |
| Immigrants | Colombia | 95.9 /100 | #114 | Exceptional 20.0% |
| Immigrants | Northern Africa | 95.8 /100 | #115 | Exceptional 20.0% |
| Immigrants | Kazakhstan | 95.7 /100 | #116 | Exceptional 20.0% |