Panamanian vs Colombian Family Households with Children
COMPARE
Panamanian
Colombian
Family Households with Children
Family Households with Children Comparison
Panamanians
Colombians
28.2%
FAMILY HOUSEHOLDS WITH CHILDREN
99.3/ 100
METRIC RATING
93rd/ 347
METRIC RANK
28.3%
FAMILY HOUSEHOLDS WITH CHILDREN
99.6/ 100
METRIC RATING
87th/ 347
METRIC RANK
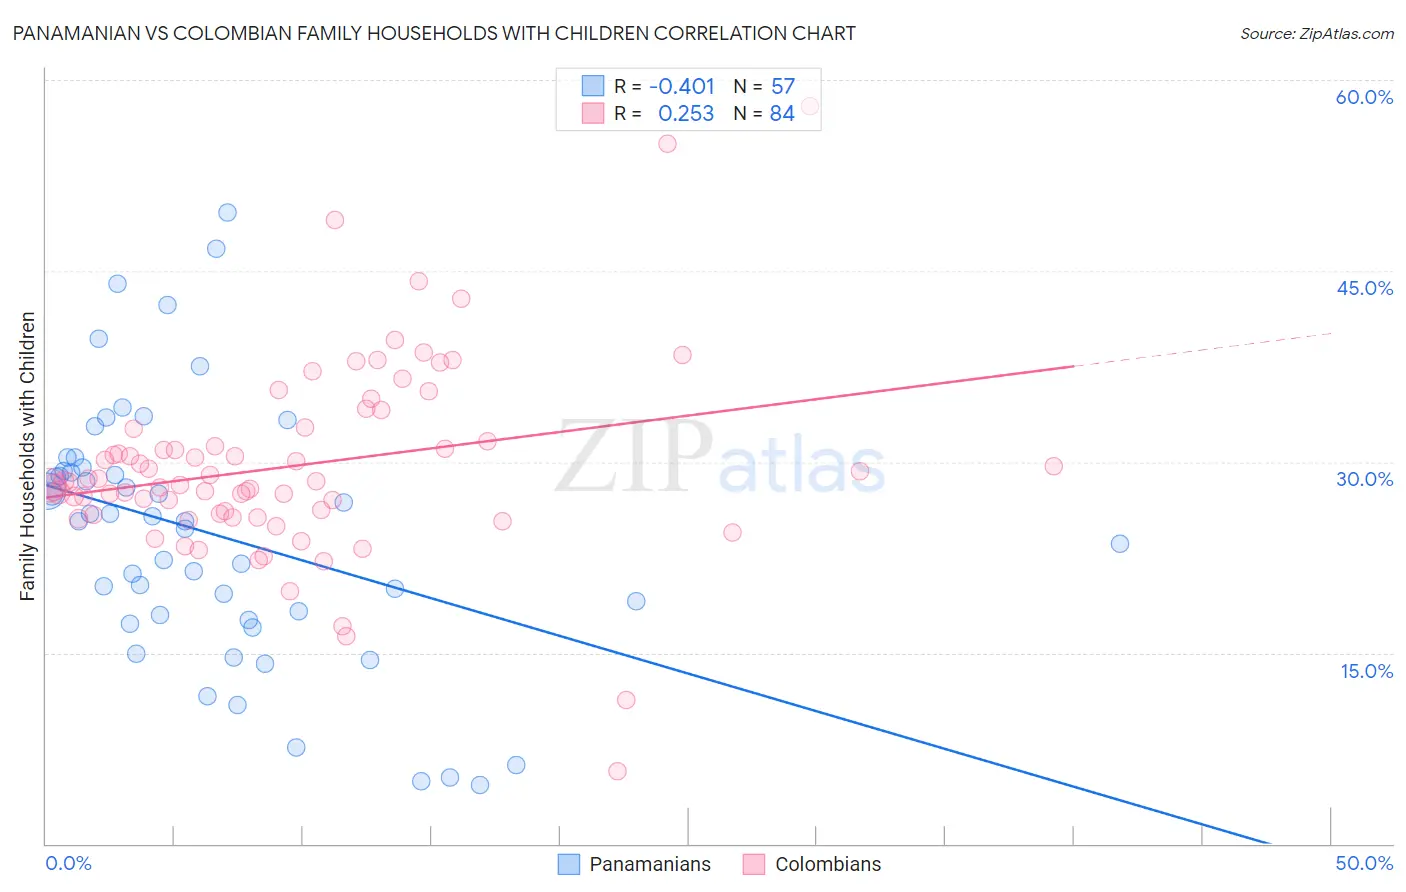
Panamanian vs Colombian Family Households with Children Correlation Chart
The statistical analysis conducted on geographies consisting of 281,035,493 people shows a moderate negative correlation between the proportion of Panamanians and percentage of family households with children in the United States with a correlation coefficient (R) of -0.401 and weighted average of 28.2%. Similarly, the statistical analysis conducted on geographies consisting of 419,165,889 people shows a weak positive correlation between the proportion of Colombians and percentage of family households with children in the United States with a correlation coefficient (R) of 0.253 and weighted average of 28.3%, a difference of 0.31%.
Family Households with Children Correlation Summary
| Measurement | Panamanian | Colombian |
| Minimum | 4.6% | 5.7% |
| Maximum | 49.6% | 57.9% |
| Range | 45.0% | 52.2% |
| Mean | 24.4% | 29.7% |
| Median | 25.4% | 28.4% |
| Interquartile 25% (IQ1) | 17.8% | 25.9% |
| Interquartile 75% (IQ3) | 29.4% | 32.1% |
| Interquartile Range (IQR) | 11.7% | 6.3% |
| Standard Deviation (Sample) | 10.2% | 7.7% |
| Standard Deviation (Population) | 10.1% | 7.7% |
Demographics Similar to Panamanians and Colombians by Family Households with Children
In terms of family households with children, the demographic groups most similar to Panamanians are Immigrants from Colombia (28.2%, a difference of 0.050%), Chickasaw (28.2%, a difference of 0.11%), Immigrants from Nicaragua (28.2%, a difference of 0.11%), Immigrants from Liberia (28.2%, a difference of 0.13%), and Ute (28.2%, a difference of 0.14%). Similarly, the demographic groups most similar to Colombians are Liberian (28.3%, a difference of 0.010%), Immigrants from Costa Rica (28.3%, a difference of 0.020%), Immigrants from Western Africa (28.3%, a difference of 0.060%), Immigrants from Thailand (28.2%, a difference of 0.13%), and Immigrants from Liberia (28.2%, a difference of 0.18%).
| Demographics | Rating | Rank | Family Households with Children |
| Natives/Alaskans | 99.8 /100 | #80 | Exceptional 28.4% |
| South Americans | 99.8 /100 | #81 | Exceptional 28.4% |
| Kenyans | 99.8 /100 | #82 | Exceptional 28.4% |
| Nicaraguans | 99.8 /100 | #83 | Exceptional 28.4% |
| Costa Ricans | 99.8 /100 | #84 | Exceptional 28.4% |
| Immigrants | Syria | 99.8 /100 | #85 | Exceptional 28.4% |
| Immigrants | Western Africa | 99.6 /100 | #86 | Exceptional 28.3% |
| Colombians | 99.6 /100 | #87 | Exceptional 28.3% |
| Liberians | 99.6 /100 | #88 | Exceptional 28.3% |
| Immigrants | Costa Rica | 99.6 /100 | #89 | Exceptional 28.3% |
| Immigrants | Thailand | 99.5 /100 | #90 | Exceptional 28.2% |
| Immigrants | Liberia | 99.4 /100 | #91 | Exceptional 28.2% |
| Chickasaw | 99.4 /100 | #92 | Exceptional 28.2% |
| Panamanians | 99.3 /100 | #93 | Exceptional 28.2% |
| Immigrants | Colombia | 99.2 /100 | #94 | Exceptional 28.2% |
| Immigrants | Nicaragua | 99.1 /100 | #95 | Exceptional 28.2% |
| Ute | 99.1 /100 | #96 | Exceptional 28.2% |
| Chileans | 98.9 /100 | #97 | Exceptional 28.1% |
| Immigrants | Kenya | 98.9 /100 | #98 | Exceptional 28.1% |
| Immigrants | Azores | 98.8 /100 | #99 | Exceptional 28.1% |
| Indonesians | 98.8 /100 | #100 | Exceptional 28.1% |