Immigrants from Eastern Africa vs Colombian Single Female Poverty
COMPARE
Immigrants from Eastern Africa
Colombian
Single Female Poverty
Single Female Poverty Comparison
Immigrants from Eastern Africa
Colombians
21.6%
SINGLE FEMALE POVERTY
15.1/ 100
METRIC RATING
209th/ 347
METRIC RANK
19.9%
SINGLE FEMALE POVERTY
96.6/ 100
METRIC RATING
109th/ 347
METRIC RANK
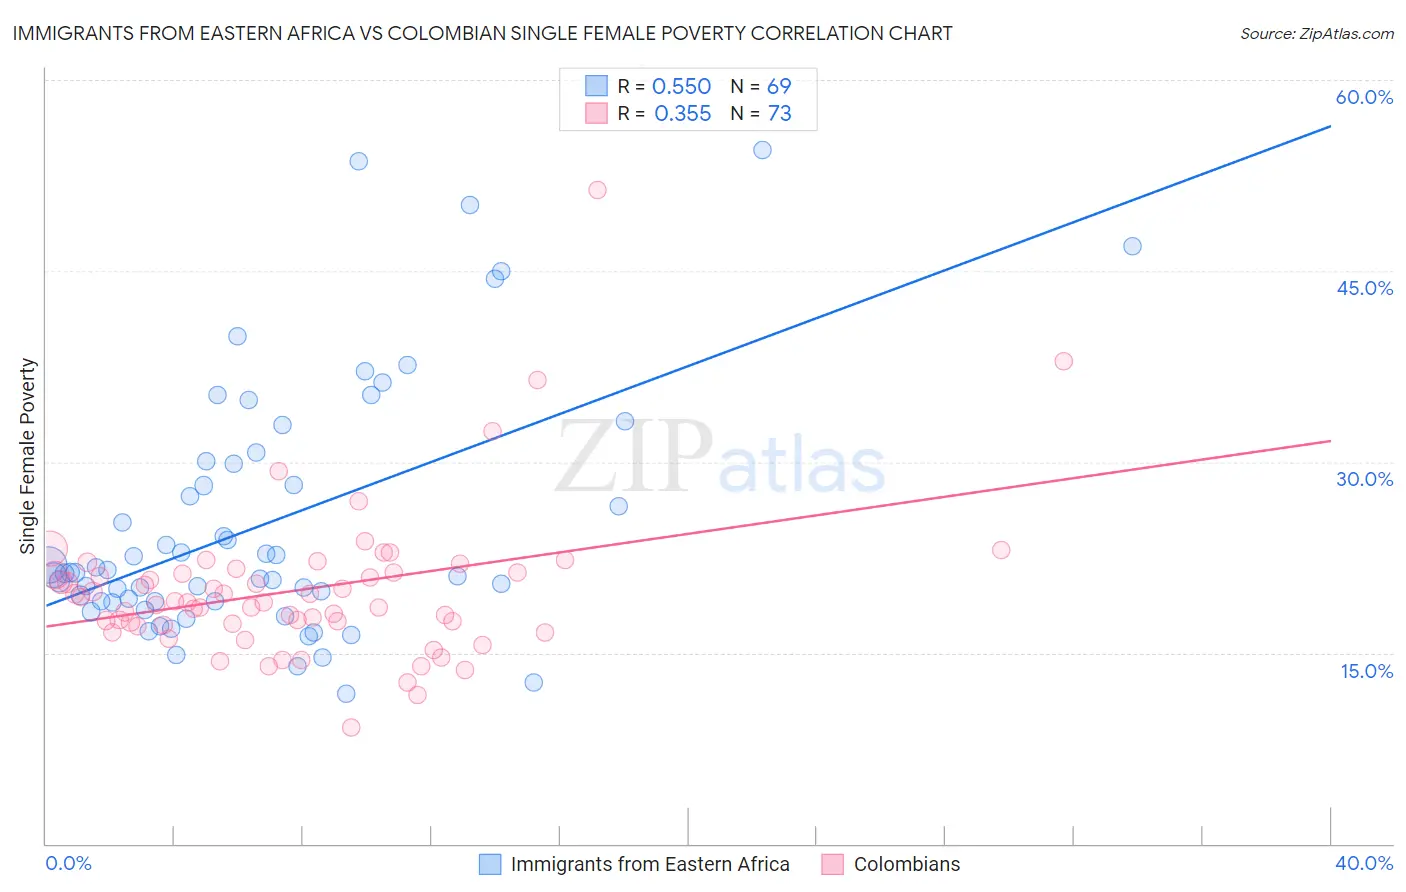
Immigrants from Eastern Africa vs Colombian Single Female Poverty Correlation Chart
The statistical analysis conducted on geographies consisting of 351,272,292 people shows a substantial positive correlation between the proportion of Immigrants from Eastern Africa and poverty level among single females in the United States with a correlation coefficient (R) of 0.550 and weighted average of 21.6%. Similarly, the statistical analysis conducted on geographies consisting of 412,800,850 people shows a mild positive correlation between the proportion of Colombians and poverty level among single females in the United States with a correlation coefficient (R) of 0.355 and weighted average of 19.9%, a difference of 8.3%.
Single Female Poverty Correlation Summary
| Measurement | Immigrants from Eastern Africa | Colombian |
| Minimum | 11.8% | 9.2% |
| Maximum | 54.5% | 51.3% |
| Range | 42.7% | 42.2% |
| Mean | 25.1% | 19.9% |
| Median | 21.3% | 19.0% |
| Interquartile 25% (IQ1) | 19.0% | 17.2% |
| Interquartile 75% (IQ3) | 29.9% | 21.3% |
| Interquartile Range (IQR) | 10.9% | 4.1% |
| Standard Deviation (Sample) | 9.9% | 6.0% |
| Standard Deviation (Population) | 9.8% | 6.0% |
Similar Demographics by Single Female Poverty
Demographics Similar to Immigrants from Eastern Africa by Single Female Poverty
In terms of single female poverty, the demographic groups most similar to Immigrants from Eastern Africa are Haitian (21.6%, a difference of 0.030%), Ghanaian (21.6%, a difference of 0.070%), Immigrants from Panama (21.6%, a difference of 0.090%), Belgian (21.5%, a difference of 0.11%), and Finnish (21.5%, a difference of 0.12%).
| Demographics | Rating | Rank | Single Female Poverty |
| Immigrants | Kenya | 20.7 /100 | #202 | Fair 21.4% |
| Immigrants | Haiti | 18.8 /100 | #203 | Poor 21.5% |
| Immigrants | Africa | 16.7 /100 | #204 | Poor 21.5% |
| Finns | 16.2 /100 | #205 | Poor 21.5% |
| Belgians | 16.1 /100 | #206 | Poor 21.5% |
| Ghanaians | 15.7 /100 | #207 | Poor 21.6% |
| Haitians | 15.4 /100 | #208 | Poor 21.6% |
| Immigrants | Eastern Africa | 15.1 /100 | #209 | Poor 21.6% |
| Immigrants | Panama | 14.4 /100 | #210 | Poor 21.6% |
| Icelanders | 14.0 /100 | #211 | Poor 21.6% |
| Jamaicans | 14.0 /100 | #212 | Poor 21.6% |
| Guamanians/Chamorros | 13.7 /100 | #213 | Poor 21.6% |
| Immigrants | Nicaragua | 13.3 /100 | #214 | Poor 21.6% |
| Ecuadorians | 12.3 /100 | #215 | Poor 21.6% |
| Immigrants | Barbados | 12.2 /100 | #216 | Poor 21.7% |
Demographics Similar to Colombians by Single Female Poverty
In terms of single female poverty, the demographic groups most similar to Colombians are Native Hawaiian (19.9%, a difference of 0.0%), Immigrants from Western Asia (19.9%, a difference of 0.010%), Immigrants from Syria (19.9%, a difference of 0.060%), Ethiopian (19.9%, a difference of 0.070%), and Israeli (19.9%, a difference of 0.17%).
| Demographics | Rating | Rank | Single Female Poverty |
| Immigrants | Cameroon | 97.3 /100 | #102 | Exceptional 19.8% |
| Immigrants | Southern Europe | 97.1 /100 | #103 | Exceptional 19.9% |
| Chileans | 96.9 /100 | #104 | Exceptional 19.9% |
| Israelis | 96.9 /100 | #105 | Exceptional 19.9% |
| Ethiopians | 96.7 /100 | #106 | Exceptional 19.9% |
| Immigrants | Syria | 96.7 /100 | #107 | Exceptional 19.9% |
| Native Hawaiians | 96.6 /100 | #108 | Exceptional 19.9% |
| Colombians | 96.6 /100 | #109 | Exceptional 19.9% |
| Immigrants | Western Asia | 96.5 /100 | #110 | Exceptional 19.9% |
| Carpatho Rusyns | 96.1 /100 | #111 | Exceptional 20.0% |
| Immigrants | Netherlands | 96.0 /100 | #112 | Exceptional 20.0% |
| Immigrants | Zimbabwe | 95.9 /100 | #113 | Exceptional 20.0% |
| Immigrants | Colombia | 95.9 /100 | #114 | Exceptional 20.0% |
| Immigrants | Northern Africa | 95.8 /100 | #115 | Exceptional 20.0% |
| Immigrants | Kazakhstan | 95.7 /100 | #116 | Exceptional 20.0% |