Iraqi vs Palestinian Family Poverty
COMPARE
Iraqi
Palestinian
Family Poverty
Family Poverty Comparison
Iraqis
Palestinians
9.3%
FAMILY POVERTY
24.2/ 100
METRIC RATING
198th/ 347
METRIC RANK
8.3%
FAMILY POVERTY
91.1/ 100
METRIC RATING
123rd/ 347
METRIC RANK
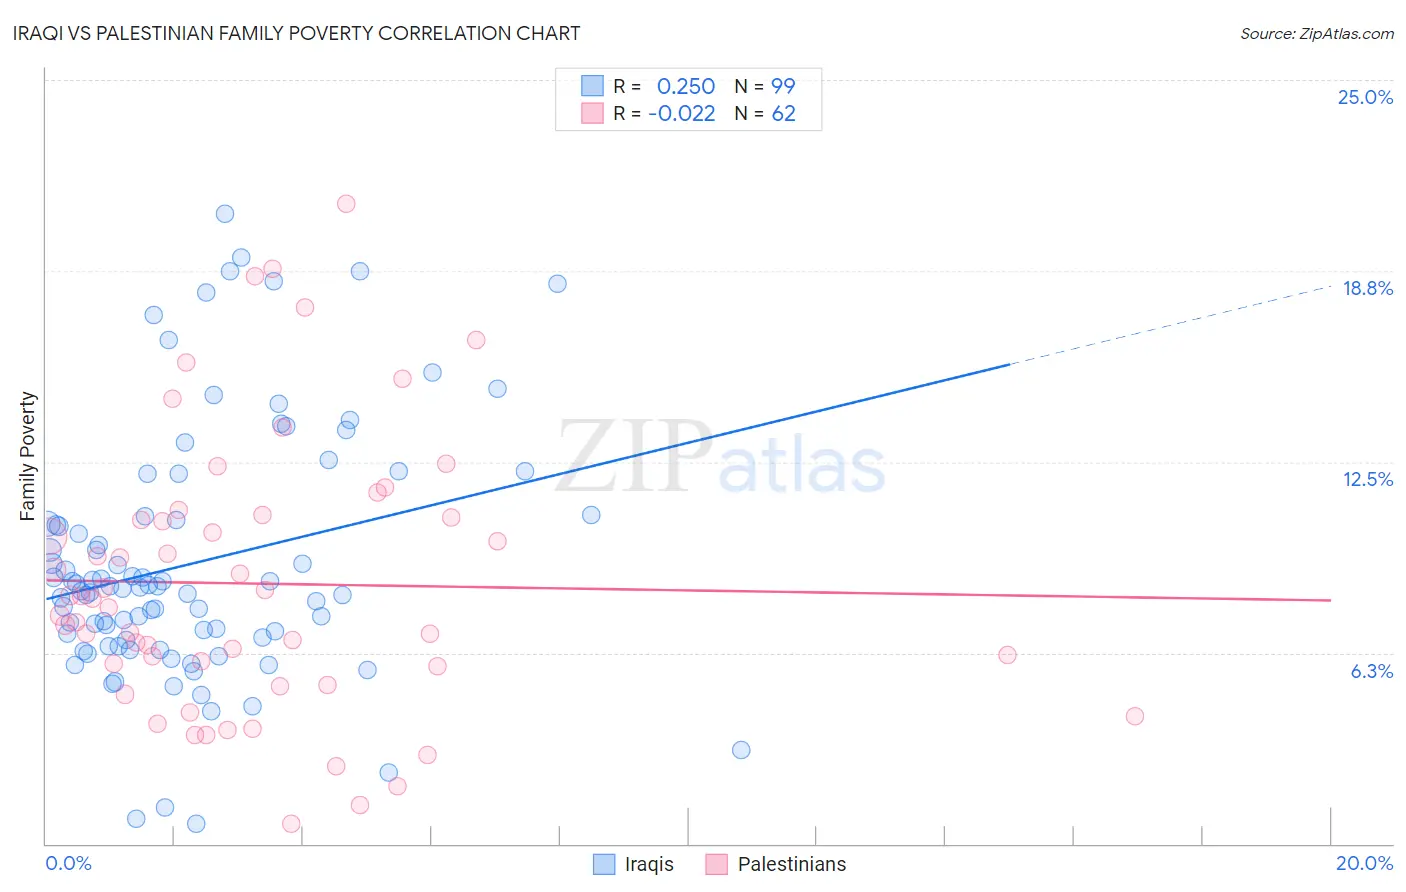
Iraqi vs Palestinian Family Poverty Correlation Chart
The statistical analysis conducted on geographies consisting of 170,433,754 people shows a weak positive correlation between the proportion of Iraqis and poverty level among families in the United States with a correlation coefficient (R) of 0.250 and weighted average of 9.3%. Similarly, the statistical analysis conducted on geographies consisting of 216,211,799 people shows no correlation between the proportion of Palestinians and poverty level among families in the United States with a correlation coefficient (R) of -0.022 and weighted average of 8.3%, a difference of 12.3%.
Family Poverty Correlation Summary
| Measurement | Iraqi | Palestinian |
| Minimum | 0.67% | 0.67% |
| Maximum | 20.6% | 21.0% |
| Range | 19.9% | 20.3% |
| Mean | 9.2% | 8.5% |
| Median | 8.4% | 7.9% |
| Interquartile 25% (IQ1) | 6.7% | 5.8% |
| Interquartile 75% (IQ3) | 10.7% | 10.7% |
| Interquartile Range (IQR) | 4.1% | 4.9% |
| Standard Deviation (Sample) | 4.1% | 4.5% |
| Standard Deviation (Population) | 4.1% | 4.4% |
Similar Demographics by Family Poverty
Demographics Similar to Iraqis by Family Poverty
In terms of family poverty, the demographic groups most similar to Iraqis are Immigrants from Colombia (9.3%, a difference of 0.030%), Spaniard (9.4%, a difference of 0.25%), Immigrants from Venezuela (9.3%, a difference of 0.32%), Immigrants from Costa Rica (9.4%, a difference of 0.44%), and Venezuelan (9.3%, a difference of 0.53%).
| Demographics | Rating | Rank | Family Poverty |
| Ugandans | 28.7 /100 | #191 | Fair 9.3% |
| Spanish | 28.7 /100 | #192 | Fair 9.3% |
| Immigrants | Western Asia | 28.2 /100 | #193 | Fair 9.3% |
| South Americans | 28.1 /100 | #194 | Fair 9.3% |
| Venezuelans | 27.4 /100 | #195 | Fair 9.3% |
| Immigrants | Venezuela | 26.1 /100 | #196 | Fair 9.3% |
| Immigrants | Colombia | 24.4 /100 | #197 | Fair 9.3% |
| Iraqis | 24.2 /100 | #198 | Fair 9.3% |
| Spaniards | 22.8 /100 | #199 | Fair 9.4% |
| Immigrants | Costa Rica | 21.7 /100 | #200 | Fair 9.4% |
| Immigrants | Portugal | 20.5 /100 | #201 | Fair 9.4% |
| Immigrants | Sierra Leone | 19.6 /100 | #202 | Poor 9.4% |
| German Russians | 19.4 /100 | #203 | Poor 9.4% |
| Immigrants | Lebanon | 18.9 /100 | #204 | Poor 9.4% |
| Aleuts | 18.0 /100 | #205 | Poor 9.5% |
Demographics Similar to Palestinians by Family Poverty
In terms of family poverty, the demographic groups most similar to Palestinians are Paraguayan (8.3%, a difference of 0.070%), Native Hawaiian (8.3%, a difference of 0.080%), Soviet Union (8.3%, a difference of 0.10%), Pakistani (8.3%, a difference of 0.14%), and Immigrants from Egypt (8.3%, a difference of 0.25%).
| Demographics | Rating | Rank | Family Poverty |
| South Africans | 93.4 /100 | #116 | Exceptional 8.2% |
| Immigrants | Russia | 93.2 /100 | #117 | Exceptional 8.2% |
| Immigrants | Western Europe | 92.9 /100 | #118 | Exceptional 8.2% |
| French | 92.8 /100 | #119 | Exceptional 8.3% |
| Immigrants | Egypt | 91.6 /100 | #120 | Exceptional 8.3% |
| Native Hawaiians | 91.3 /100 | #121 | Exceptional 8.3% |
| Paraguayans | 91.2 /100 | #122 | Exceptional 8.3% |
| Palestinians | 91.1 /100 | #123 | Exceptional 8.3% |
| Soviet Union | 90.8 /100 | #124 | Exceptional 8.3% |
| Pakistanis | 90.8 /100 | #125 | Exceptional 8.3% |
| Icelanders | 90.3 /100 | #126 | Exceptional 8.3% |
| Immigrants | Hungary | 89.9 /100 | #127 | Excellent 8.4% |
| Argentineans | 89.6 /100 | #128 | Excellent 8.4% |
| Portuguese | 89.2 /100 | #129 | Excellent 8.4% |
| Immigrants | Bosnia and Herzegovina | 88.6 /100 | #130 | Excellent 8.4% |