Nicaraguan vs Immigrants from Sweden Poverty
COMPARE
Nicaraguan
Immigrants from Sweden
Poverty
Poverty Comparison
Nicaraguans
Immigrants from Sweden
13.9%
POVERTY
0.4/ 100
METRIC RATING
239th/ 347
METRIC RANK
11.3%
POVERTY
96.3/ 100
METRIC RATING
83rd/ 347
METRIC RANK
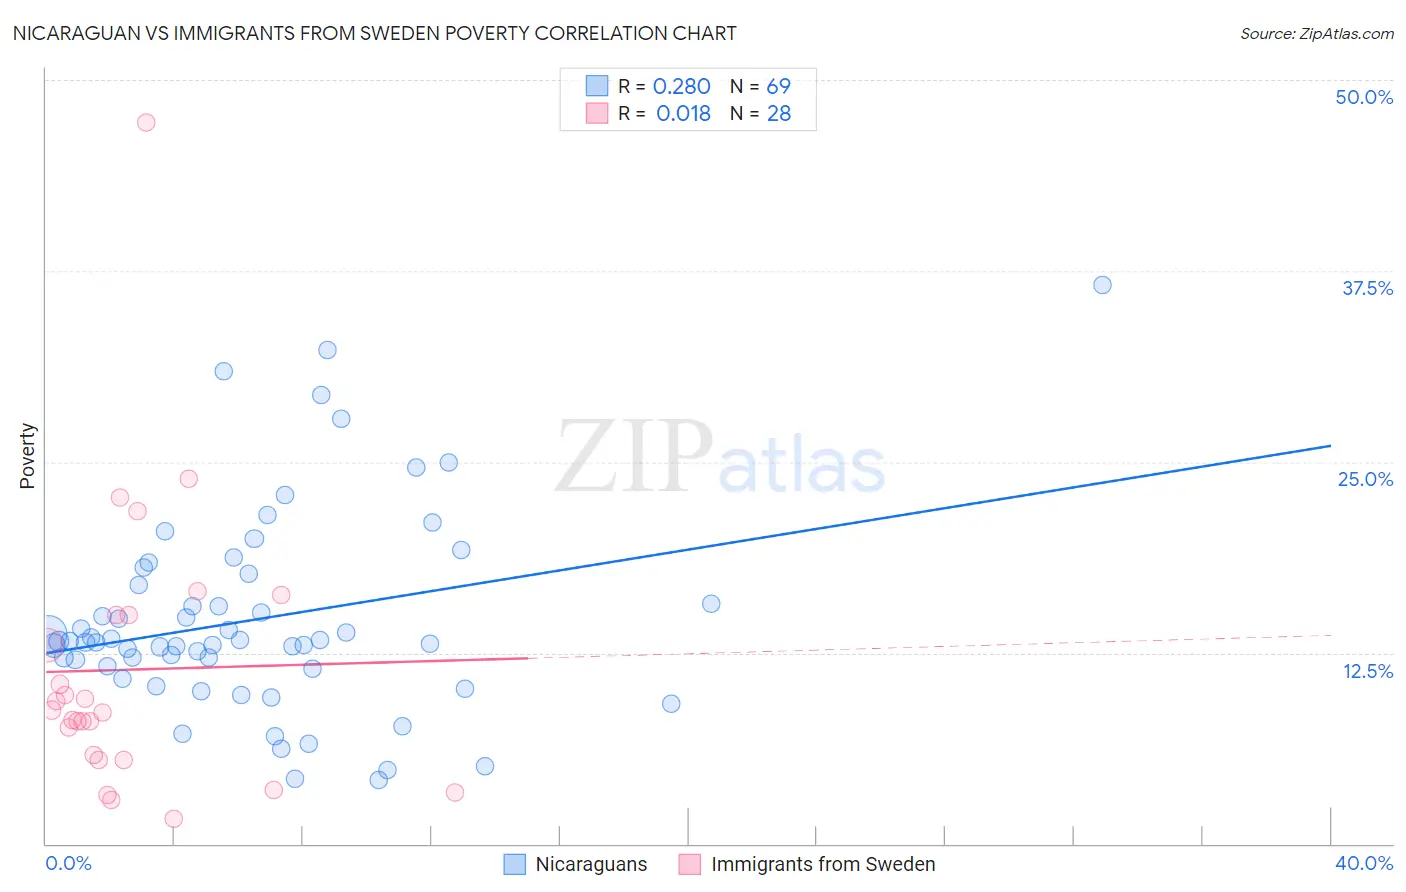
Nicaraguan vs Immigrants from Sweden Poverty Correlation Chart
The statistical analysis conducted on geographies consisting of 285,615,173 people shows a weak positive correlation between the proportion of Nicaraguans and poverty level in the United States with a correlation coefficient (R) of 0.280 and weighted average of 13.9%. Similarly, the statistical analysis conducted on geographies consisting of 164,694,810 people shows no correlation between the proportion of Immigrants from Sweden and poverty level in the United States with a correlation coefficient (R) of 0.018 and weighted average of 11.3%, a difference of 22.9%.
Poverty Correlation Summary
| Measurement | Nicaraguan | Immigrants from Sweden |
| Minimum | 4.2% | 1.7% |
| Maximum | 36.5% | 47.2% |
| Range | 32.4% | 45.6% |
| Mean | 14.7% | 11.4% |
| Median | 13.2% | 8.7% |
| Interquartile 25% (IQ1) | 11.5% | 5.7% |
| Interquartile 75% (IQ3) | 17.3% | 15.0% |
| Interquartile Range (IQR) | 5.8% | 9.3% |
| Standard Deviation (Sample) | 6.5% | 9.2% |
| Standard Deviation (Population) | 6.5% | 9.1% |
Similar Demographics by Poverty
Demographics Similar to Nicaraguans by Poverty
In terms of poverty, the demographic groups most similar to Nicaraguans are Immigrants from Middle Africa (14.0%, a difference of 0.12%), Salvadoran (14.0%, a difference of 0.14%), Ghanaian (13.9%, a difference of 0.35%), Ecuadorian (14.0%, a difference of 0.46%), and French American Indian (13.9%, a difference of 0.48%).
| Demographics | Rating | Rank | Poverty |
| Fijians | 0.8 /100 | #232 | Tragic 13.7% |
| Immigrants | Saudi Arabia | 0.8 /100 | #233 | Tragic 13.8% |
| Immigrants | Laos | 0.7 /100 | #234 | Tragic 13.8% |
| Cubans | 0.6 /100 | #235 | Tragic 13.9% |
| Immigrants | Armenia | 0.5 /100 | #236 | Tragic 13.9% |
| French American Indians | 0.5 /100 | #237 | Tragic 13.9% |
| Ghanaians | 0.5 /100 | #238 | Tragic 13.9% |
| Nicaraguans | 0.4 /100 | #239 | Tragic 13.9% |
| Immigrants | Middle Africa | 0.4 /100 | #240 | Tragic 14.0% |
| Salvadorans | 0.4 /100 | #241 | Tragic 14.0% |
| Ecuadorians | 0.4 /100 | #242 | Tragic 14.0% |
| Sudanese | 0.3 /100 | #243 | Tragic 14.0% |
| Nepalese | 0.3 /100 | #244 | Tragic 14.0% |
| Immigrants | Sudan | 0.3 /100 | #245 | Tragic 14.1% |
| Potawatomi | 0.3 /100 | #246 | Tragic 14.1% |
Demographics Similar to Immigrants from Sweden by Poverty
In terms of poverty, the demographic groups most similar to Immigrants from Sweden are English (11.3%, a difference of 0.010%), Immigrants from England (11.4%, a difference of 0.080%), Egyptian (11.3%, a difference of 0.18%), Jordanian (11.4%, a difference of 0.19%), and Northern European (11.4%, a difference of 0.20%).
| Demographics | Rating | Rank | Poverty |
| Immigrants | North America | 96.8 /100 | #76 | Exceptional 11.3% |
| Immigrants | Eastern Asia | 96.7 /100 | #77 | Exceptional 11.3% |
| Dutch | 96.7 /100 | #78 | Exceptional 11.3% |
| Cambodians | 96.7 /100 | #79 | Exceptional 11.3% |
| Indians (Asian) | 96.6 /100 | #80 | Exceptional 11.3% |
| Irish | 96.6 /100 | #81 | Exceptional 11.3% |
| Egyptians | 96.5 /100 | #82 | Exceptional 11.3% |
| Immigrants | Sweden | 96.3 /100 | #83 | Exceptional 11.3% |
| English | 96.3 /100 | #84 | Exceptional 11.3% |
| Immigrants | England | 96.2 /100 | #85 | Exceptional 11.4% |
| Jordanians | 96.0 /100 | #86 | Exceptional 11.4% |
| Northern Europeans | 96.0 /100 | #87 | Exceptional 11.4% |
| Belgians | 95.8 /100 | #88 | Exceptional 11.4% |
| Czechoslovakians | 95.7 /100 | #89 | Exceptional 11.4% |
| Immigrants | Denmark | 95.5 /100 | #90 | Exceptional 11.4% |