Afghan vs Immigrants from Sweden Poverty
COMPARE
Afghan
Immigrants from Sweden
Poverty
Poverty Comparison
Afghans
Immigrants from Sweden
12.0%
POVERTY
74.9/ 100
METRIC RATING
146th/ 347
METRIC RANK
11.3%
POVERTY
96.3/ 100
METRIC RATING
83rd/ 347
METRIC RANK
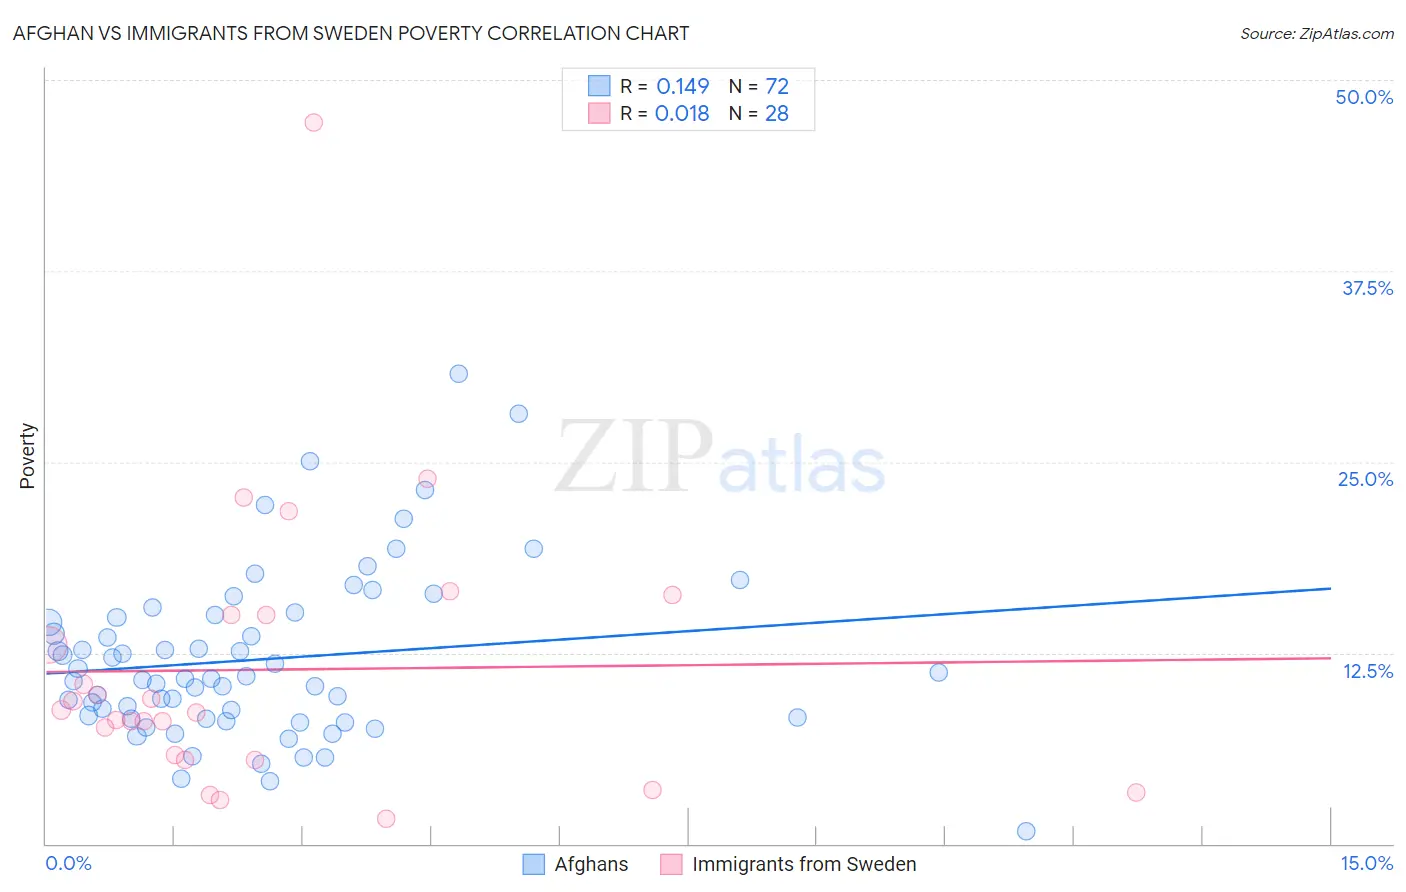
Afghan vs Immigrants from Sweden Poverty Correlation Chart
The statistical analysis conducted on geographies consisting of 148,816,997 people shows a poor positive correlation between the proportion of Afghans and poverty level in the United States with a correlation coefficient (R) of 0.149 and weighted average of 12.0%. Similarly, the statistical analysis conducted on geographies consisting of 164,694,810 people shows no correlation between the proportion of Immigrants from Sweden and poverty level in the United States with a correlation coefficient (R) of 0.018 and weighted average of 11.3%, a difference of 5.7%.
Poverty Correlation Summary
| Measurement | Afghan | Immigrants from Sweden |
| Minimum | 0.81% | 1.7% |
| Maximum | 30.8% | 47.2% |
| Range | 30.0% | 45.6% |
| Mean | 12.1% | 11.4% |
| Median | 10.8% | 8.7% |
| Interquartile 25% (IQ1) | 8.2% | 5.7% |
| Interquartile 75% (IQ3) | 14.9% | 15.0% |
| Interquartile Range (IQR) | 6.7% | 9.3% |
| Standard Deviation (Sample) | 5.5% | 9.2% |
| Standard Deviation (Population) | 5.5% | 9.1% |
Similar Demographics by Poverty
Demographics Similar to Afghans by Poverty
In terms of poverty, the demographic groups most similar to Afghans are Syrian (12.0%, a difference of 0.030%), Immigrants from Bosnia and Herzegovina (12.0%, a difference of 0.16%), Immigrants from Germany (12.0%, a difference of 0.28%), Immigrants from Malaysia (12.0%, a difference of 0.28%), and Immigrants from Kazakhstan (12.0%, a difference of 0.33%).
| Demographics | Rating | Rank | Poverty |
| Pakistanis | 82.2 /100 | #139 | Excellent 11.9% |
| Immigrants | Peru | 81.1 /100 | #140 | Excellent 11.9% |
| Immigrants | France | 80.5 /100 | #141 | Excellent 11.9% |
| Basques | 80.4 /100 | #142 | Excellent 11.9% |
| Brazilians | 79.7 /100 | #143 | Good 11.9% |
| Icelanders | 77.9 /100 | #144 | Good 11.9% |
| Syrians | 75.1 /100 | #145 | Good 12.0% |
| Afghans | 74.9 /100 | #146 | Good 12.0% |
| Immigrants | Bosnia and Herzegovina | 73.7 /100 | #147 | Good 12.0% |
| Immigrants | Germany | 72.7 /100 | #148 | Good 12.0% |
| Immigrants | Malaysia | 72.7 /100 | #149 | Good 12.0% |
| Immigrants | Kazakhstan | 72.3 /100 | #150 | Good 12.0% |
| Samoans | 71.9 /100 | #151 | Good 12.0% |
| Armenians | 67.6 /100 | #152 | Good 12.1% |
| Immigrants | Northern Africa | 63.9 /100 | #153 | Good 12.1% |
Demographics Similar to Immigrants from Sweden by Poverty
In terms of poverty, the demographic groups most similar to Immigrants from Sweden are English (11.3%, a difference of 0.010%), Immigrants from England (11.4%, a difference of 0.080%), Egyptian (11.3%, a difference of 0.18%), Jordanian (11.4%, a difference of 0.19%), and Northern European (11.4%, a difference of 0.20%).
| Demographics | Rating | Rank | Poverty |
| Immigrants | North America | 96.8 /100 | #76 | Exceptional 11.3% |
| Immigrants | Eastern Asia | 96.7 /100 | #77 | Exceptional 11.3% |
| Dutch | 96.7 /100 | #78 | Exceptional 11.3% |
| Cambodians | 96.7 /100 | #79 | Exceptional 11.3% |
| Indians (Asian) | 96.6 /100 | #80 | Exceptional 11.3% |
| Irish | 96.6 /100 | #81 | Exceptional 11.3% |
| Egyptians | 96.5 /100 | #82 | Exceptional 11.3% |
| Immigrants | Sweden | 96.3 /100 | #83 | Exceptional 11.3% |
| English | 96.3 /100 | #84 | Exceptional 11.3% |
| Immigrants | England | 96.2 /100 | #85 | Exceptional 11.4% |
| Jordanians | 96.0 /100 | #86 | Exceptional 11.4% |
| Northern Europeans | 96.0 /100 | #87 | Exceptional 11.4% |
| Belgians | 95.8 /100 | #88 | Exceptional 11.4% |
| Czechoslovakians | 95.7 /100 | #89 | Exceptional 11.4% |
| Immigrants | Denmark | 95.5 /100 | #90 | Exceptional 11.4% |