Nicaraguan vs Immigrants from Kazakhstan Poverty
COMPARE
Nicaraguan
Immigrants from Kazakhstan
Poverty
Poverty Comparison
Nicaraguans
Immigrants from Kazakhstan
13.9%
POVERTY
0.4/ 100
METRIC RATING
239th/ 347
METRIC RANK
12.0%
POVERTY
72.3/ 100
METRIC RATING
150th/ 347
METRIC RANK
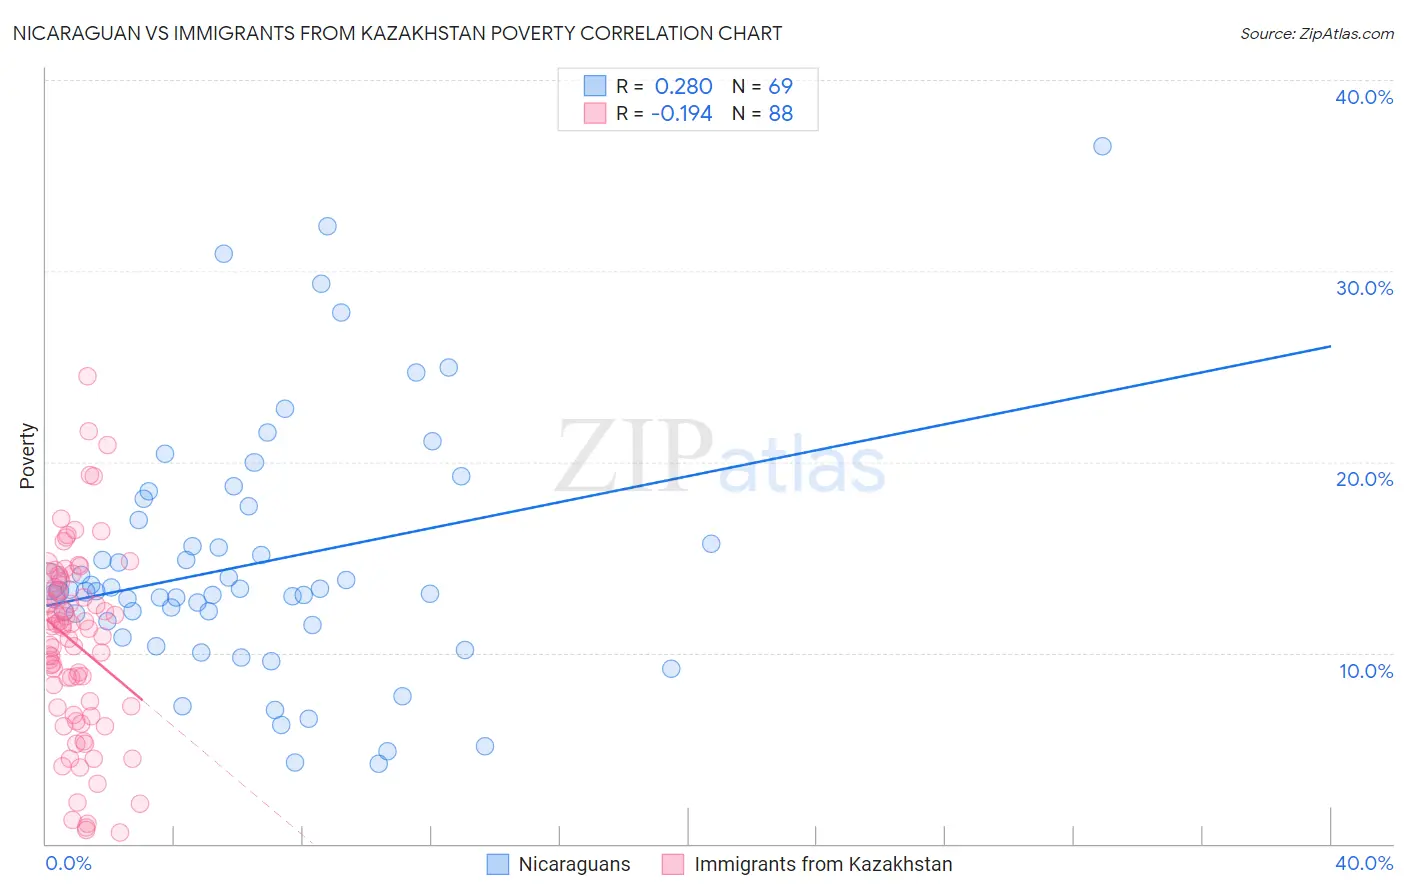
Nicaraguan vs Immigrants from Kazakhstan Poverty Correlation Chart
The statistical analysis conducted on geographies consisting of 285,615,173 people shows a weak positive correlation between the proportion of Nicaraguans and poverty level in the United States with a correlation coefficient (R) of 0.280 and weighted average of 13.9%. Similarly, the statistical analysis conducted on geographies consisting of 124,425,744 people shows a poor negative correlation between the proportion of Immigrants from Kazakhstan and poverty level in the United States with a correlation coefficient (R) of -0.194 and weighted average of 12.0%, a difference of 15.9%.
Poverty Correlation Summary
| Measurement | Nicaraguan | Immigrants from Kazakhstan |
| Minimum | 4.2% | 0.57% |
| Maximum | 36.5% | 24.5% |
| Range | 32.4% | 23.9% |
| Mean | 14.7% | 10.5% |
| Median | 13.2% | 11.3% |
| Interquartile 25% (IQ1) | 11.5% | 6.9% |
| Interquartile 75% (IQ3) | 17.3% | 13.6% |
| Interquartile Range (IQR) | 5.8% | 6.6% |
| Standard Deviation (Sample) | 6.5% | 4.9% |
| Standard Deviation (Population) | 6.5% | 4.9% |
Similar Demographics by Poverty
Demographics Similar to Nicaraguans by Poverty
In terms of poverty, the demographic groups most similar to Nicaraguans are Immigrants from Middle Africa (14.0%, a difference of 0.12%), Salvadoran (14.0%, a difference of 0.14%), Ghanaian (13.9%, a difference of 0.35%), Ecuadorian (14.0%, a difference of 0.46%), and French American Indian (13.9%, a difference of 0.48%).
| Demographics | Rating | Rank | Poverty |
| Fijians | 0.8 /100 | #232 | Tragic 13.7% |
| Immigrants | Saudi Arabia | 0.8 /100 | #233 | Tragic 13.8% |
| Immigrants | Laos | 0.7 /100 | #234 | Tragic 13.8% |
| Cubans | 0.6 /100 | #235 | Tragic 13.9% |
| Immigrants | Armenia | 0.5 /100 | #236 | Tragic 13.9% |
| French American Indians | 0.5 /100 | #237 | Tragic 13.9% |
| Ghanaians | 0.5 /100 | #238 | Tragic 13.9% |
| Nicaraguans | 0.4 /100 | #239 | Tragic 13.9% |
| Immigrants | Middle Africa | 0.4 /100 | #240 | Tragic 14.0% |
| Salvadorans | 0.4 /100 | #241 | Tragic 14.0% |
| Ecuadorians | 0.4 /100 | #242 | Tragic 14.0% |
| Sudanese | 0.3 /100 | #243 | Tragic 14.0% |
| Nepalese | 0.3 /100 | #244 | Tragic 14.0% |
| Immigrants | Sudan | 0.3 /100 | #245 | Tragic 14.1% |
| Potawatomi | 0.3 /100 | #246 | Tragic 14.1% |
Demographics Similar to Immigrants from Kazakhstan by Poverty
In terms of poverty, the demographic groups most similar to Immigrants from Kazakhstan are Samoan (12.0%, a difference of 0.040%), Immigrants from Germany (12.0%, a difference of 0.050%), Immigrants from Malaysia (12.0%, a difference of 0.050%), Immigrants from Bosnia and Herzegovina (12.0%, a difference of 0.17%), and Afghan (12.0%, a difference of 0.33%).
| Demographics | Rating | Rank | Poverty |
| Brazilians | 79.7 /100 | #143 | Good 11.9% |
| Icelanders | 77.9 /100 | #144 | Good 11.9% |
| Syrians | 75.1 /100 | #145 | Good 12.0% |
| Afghans | 74.9 /100 | #146 | Good 12.0% |
| Immigrants | Bosnia and Herzegovina | 73.7 /100 | #147 | Good 12.0% |
| Immigrants | Germany | 72.7 /100 | #148 | Good 12.0% |
| Immigrants | Malaysia | 72.7 /100 | #149 | Good 12.0% |
| Immigrants | Kazakhstan | 72.3 /100 | #150 | Good 12.0% |
| Samoans | 71.9 /100 | #151 | Good 12.0% |
| Armenians | 67.6 /100 | #152 | Good 12.1% |
| Immigrants | Northern Africa | 63.9 /100 | #153 | Good 12.1% |
| Guamanians/Chamorros | 63.9 /100 | #154 | Good 12.1% |
| Hungarians | 63.6 /100 | #155 | Good 12.2% |
| Scotch-Irish | 62.6 /100 | #156 | Good 12.2% |
| Costa Ricans | 62.2 /100 | #157 | Good 12.2% |