Nicaraguan vs Immigrants from El Salvador Poverty
COMPARE
Nicaraguan
Immigrants from El Salvador
Poverty
Poverty Comparison
Nicaraguans
Immigrants from El Salvador
13.9%
POVERTY
0.4/ 100
METRIC RATING
239th/ 347
METRIC RANK
14.3%
POVERTY
0.1/ 100
METRIC RATING
254th/ 347
METRIC RANK
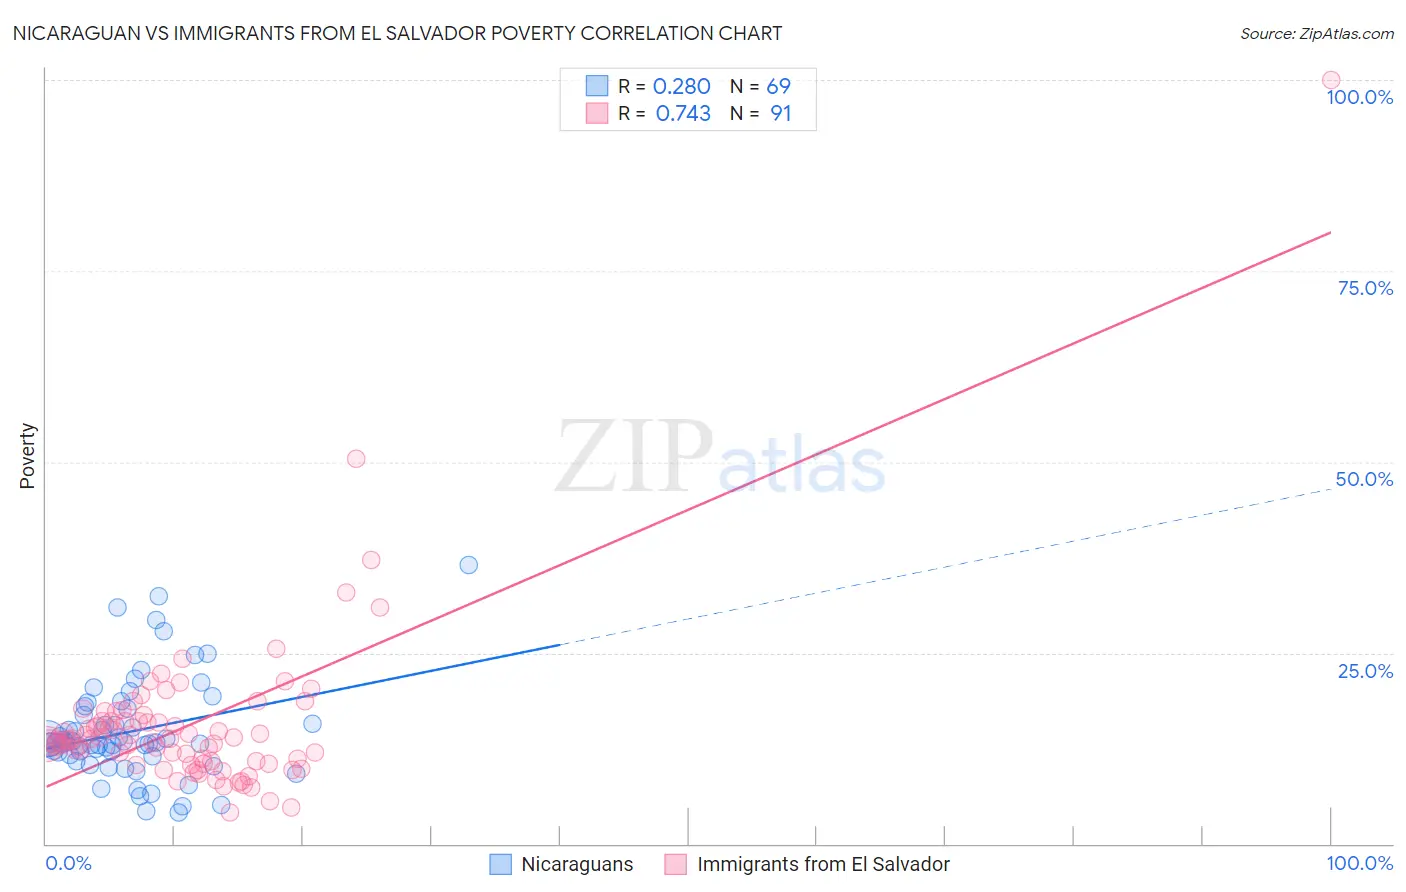
Nicaraguan vs Immigrants from El Salvador Poverty Correlation Chart
The statistical analysis conducted on geographies consisting of 285,615,173 people shows a weak positive correlation between the proportion of Nicaraguans and poverty level in the United States with a correlation coefficient (R) of 0.280 and weighted average of 13.9%. Similarly, the statistical analysis conducted on geographies consisting of 357,703,291 people shows a strong positive correlation between the proportion of Immigrants from El Salvador and poverty level in the United States with a correlation coefficient (R) of 0.743 and weighted average of 14.3%, a difference of 2.4%.
Poverty Correlation Summary
| Measurement | Nicaraguan | Immigrants from El Salvador |
| Minimum | 4.2% | 4.1% |
| Maximum | 36.5% | 100.0% |
| Range | 32.4% | 95.9% |
| Mean | 14.7% | 15.6% |
| Median | 13.2% | 13.5% |
| Interquartile 25% (IQ1) | 11.5% | 10.8% |
| Interquartile 75% (IQ3) | 17.3% | 16.1% |
| Interquartile Range (IQR) | 5.8% | 5.3% |
| Standard Deviation (Sample) | 6.5% | 11.2% |
| Standard Deviation (Population) | 6.5% | 11.1% |
Demographics Similar to Nicaraguans and Immigrants from El Salvador by Poverty
In terms of poverty, the demographic groups most similar to Nicaraguans are Immigrants from Middle Africa (14.0%, a difference of 0.12%), Salvadoran (14.0%, a difference of 0.14%), Ghanaian (13.9%, a difference of 0.35%), Ecuadorian (14.0%, a difference of 0.46%), and French American Indian (13.9%, a difference of 0.48%). Similarly, the demographic groups most similar to Immigrants from El Salvador are Immigrants from Ecuador (14.3%, a difference of 0.10%), Mexican American Indian (14.3%, a difference of 0.11%), Immigrants from Trinidad and Tobago (14.2%, a difference of 0.25%), Spanish American Indian (14.2%, a difference of 0.36%), and Immigrants from Burma/Myanmar (14.2%, a difference of 0.47%).
| Demographics | Rating | Rank | Poverty |
| Immigrants | Armenia | 0.5 /100 | #236 | Tragic 13.9% |
| French American Indians | 0.5 /100 | #237 | Tragic 13.9% |
| Ghanaians | 0.5 /100 | #238 | Tragic 13.9% |
| Nicaraguans | 0.4 /100 | #239 | Tragic 13.9% |
| Immigrants | Middle Africa | 0.4 /100 | #240 | Tragic 14.0% |
| Salvadorans | 0.4 /100 | #241 | Tragic 14.0% |
| Ecuadorians | 0.4 /100 | #242 | Tragic 14.0% |
| Sudanese | 0.3 /100 | #243 | Tragic 14.0% |
| Nepalese | 0.3 /100 | #244 | Tragic 14.0% |
| Immigrants | Sudan | 0.3 /100 | #245 | Tragic 14.1% |
| Potawatomi | 0.3 /100 | #246 | Tragic 14.1% |
| Liberians | 0.2 /100 | #247 | Tragic 14.1% |
| Immigrants | Western Africa | 0.2 /100 | #248 | Tragic 14.1% |
| Immigrants | Ghana | 0.2 /100 | #249 | Tragic 14.2% |
| Cree | 0.2 /100 | #250 | Tragic 14.2% |
| Immigrants | Burma/Myanmar | 0.2 /100 | #251 | Tragic 14.2% |
| Spanish American Indians | 0.2 /100 | #252 | Tragic 14.2% |
| Immigrants | Trinidad and Tobago | 0.2 /100 | #253 | Tragic 14.2% |
| Immigrants | El Salvador | 0.1 /100 | #254 | Tragic 14.3% |
| Immigrants | Ecuador | 0.1 /100 | #255 | Tragic 14.3% |
| Mexican American Indians | 0.1 /100 | #256 | Tragic 14.3% |