Panamanian vs Immigrants from Kazakhstan Poverty
COMPARE
Panamanian
Immigrants from Kazakhstan
Poverty
Poverty Comparison
Panamanians
Immigrants from Kazakhstan
13.1%
POVERTY
6.6/ 100
METRIC RATING
207th/ 347
METRIC RANK
12.0%
POVERTY
72.3/ 100
METRIC RATING
150th/ 347
METRIC RANK
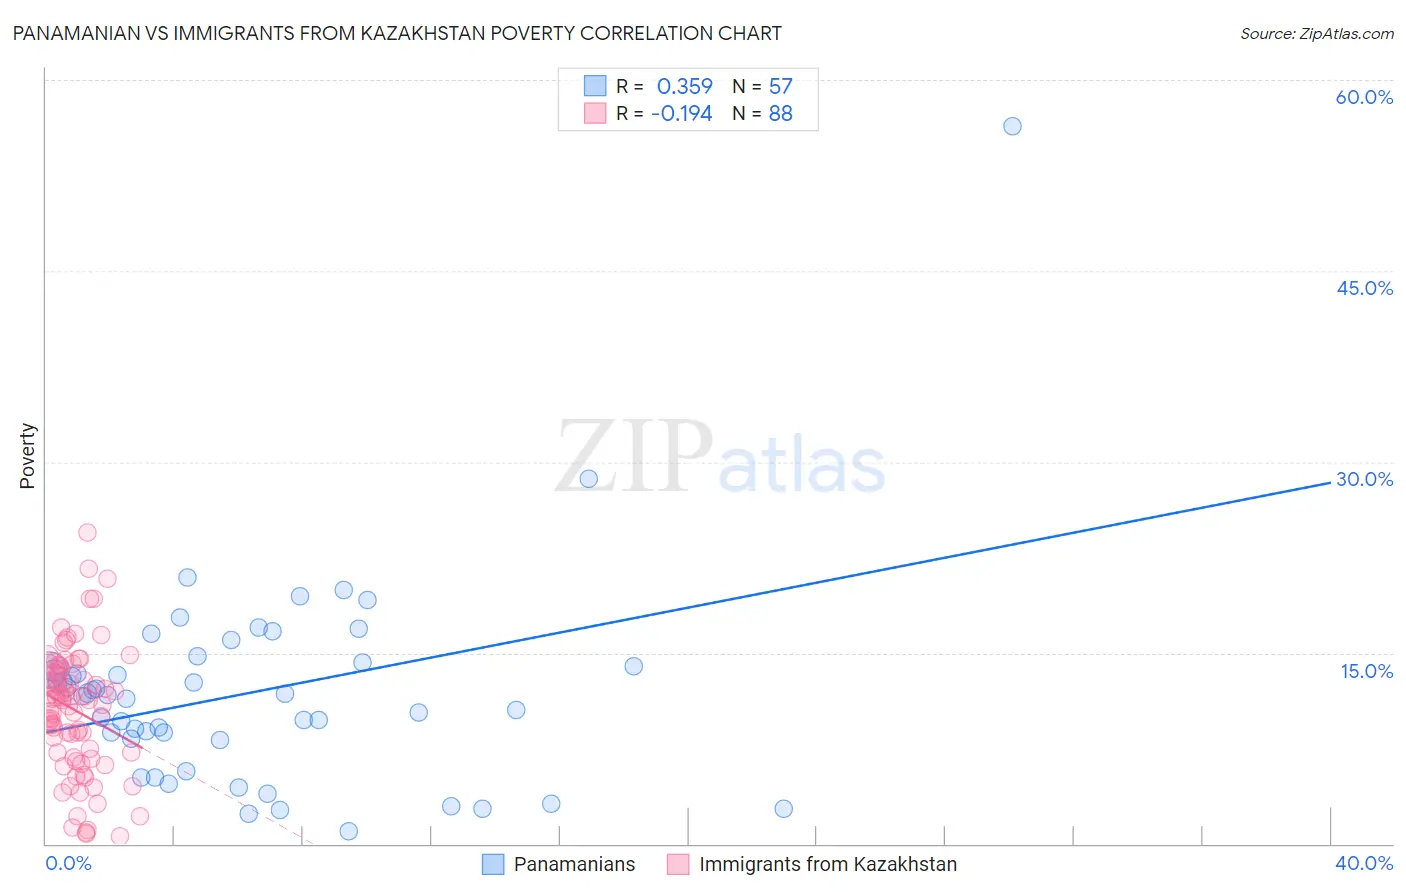
Panamanian vs Immigrants from Kazakhstan Poverty Correlation Chart
The statistical analysis conducted on geographies consisting of 281,075,399 people shows a mild positive correlation between the proportion of Panamanians and poverty level in the United States with a correlation coefficient (R) of 0.359 and weighted average of 13.1%. Similarly, the statistical analysis conducted on geographies consisting of 124,425,744 people shows a poor negative correlation between the proportion of Immigrants from Kazakhstan and poverty level in the United States with a correlation coefficient (R) of -0.194 and weighted average of 12.0%, a difference of 8.9%.
Poverty Correlation Summary
| Measurement | Panamanian | Immigrants from Kazakhstan |
| Minimum | 0.99% | 0.57% |
| Maximum | 56.4% | 24.5% |
| Range | 55.4% | 23.9% |
| Mean | 11.9% | 10.5% |
| Median | 11.7% | 11.3% |
| Interquartile 25% (IQ1) | 8.2% | 6.9% |
| Interquartile 75% (IQ3) | 14.1% | 13.6% |
| Interquartile Range (IQR) | 5.9% | 6.6% |
| Standard Deviation (Sample) | 8.1% | 4.9% |
| Standard Deviation (Population) | 8.1% | 4.9% |
Similar Demographics by Poverty
Demographics Similar to Panamanians by Poverty
In terms of poverty, the demographic groups most similar to Panamanians are Immigrants from Eastern Africa (13.1%, a difference of 0.12%), Ugandan (13.1%, a difference of 0.15%), Malaysian (13.1%, a difference of 0.18%), Immigrants from the Azores (13.1%, a difference of 0.21%), and Moroccan (13.2%, a difference of 0.57%).
| Demographics | Rating | Rank | Poverty |
| Spaniards | 16.5 /100 | #200 | Poor 12.8% |
| Immigrants | Uganda | 16.5 /100 | #201 | Poor 12.8% |
| Immigrants | Uruguay | 15.6 /100 | #202 | Poor 12.8% |
| Hmong | 15.0 /100 | #203 | Poor 12.8% |
| Immigrants | Western Asia | 14.1 /100 | #204 | Poor 12.9% |
| Tsimshian | 9.2 /100 | #205 | Tragic 13.0% |
| Immigrants | Eastern Africa | 7.0 /100 | #206 | Tragic 13.1% |
| Panamanians | 6.6 /100 | #207 | Tragic 13.1% |
| Ugandans | 6.2 /100 | #208 | Tragic 13.1% |
| Malaysians | 6.1 /100 | #209 | Tragic 13.1% |
| Immigrants | Azores | 6.1 /100 | #210 | Tragic 13.1% |
| Moroccans | 5.2 /100 | #211 | Tragic 13.2% |
| Immigrants | Immigrants | 4.3 /100 | #212 | Tragic 13.2% |
| Immigrants | Panama | 4.1 /100 | #213 | Tragic 13.3% |
| Bermudans | 3.7 /100 | #214 | Tragic 13.3% |
Demographics Similar to Immigrants from Kazakhstan by Poverty
In terms of poverty, the demographic groups most similar to Immigrants from Kazakhstan are Samoan (12.0%, a difference of 0.040%), Immigrants from Germany (12.0%, a difference of 0.050%), Immigrants from Malaysia (12.0%, a difference of 0.050%), Immigrants from Bosnia and Herzegovina (12.0%, a difference of 0.17%), and Afghan (12.0%, a difference of 0.33%).
| Demographics | Rating | Rank | Poverty |
| Brazilians | 79.7 /100 | #143 | Good 11.9% |
| Icelanders | 77.9 /100 | #144 | Good 11.9% |
| Syrians | 75.1 /100 | #145 | Good 12.0% |
| Afghans | 74.9 /100 | #146 | Good 12.0% |
| Immigrants | Bosnia and Herzegovina | 73.7 /100 | #147 | Good 12.0% |
| Immigrants | Germany | 72.7 /100 | #148 | Good 12.0% |
| Immigrants | Malaysia | 72.7 /100 | #149 | Good 12.0% |
| Immigrants | Kazakhstan | 72.3 /100 | #150 | Good 12.0% |
| Samoans | 71.9 /100 | #151 | Good 12.0% |
| Armenians | 67.6 /100 | #152 | Good 12.1% |
| Immigrants | Northern Africa | 63.9 /100 | #153 | Good 12.1% |
| Guamanians/Chamorros | 63.9 /100 | #154 | Good 12.1% |
| Hungarians | 63.6 /100 | #155 | Good 12.2% |
| Scotch-Irish | 62.6 /100 | #156 | Good 12.2% |
| Costa Ricans | 62.2 /100 | #157 | Good 12.2% |