New Zealander vs Filipino Family Poverty
COMPARE
New Zealander
Filipino
Family Poverty
Family Poverty Comparison
New Zealanders
Filipinos
8.1%
FAMILY POVERTY
95.8/ 100
METRIC RATING
100th/ 347
METRIC RANK
6.6%
FAMILY POVERTY
100.0/ 100
METRIC RATING
4th/ 347
METRIC RANK
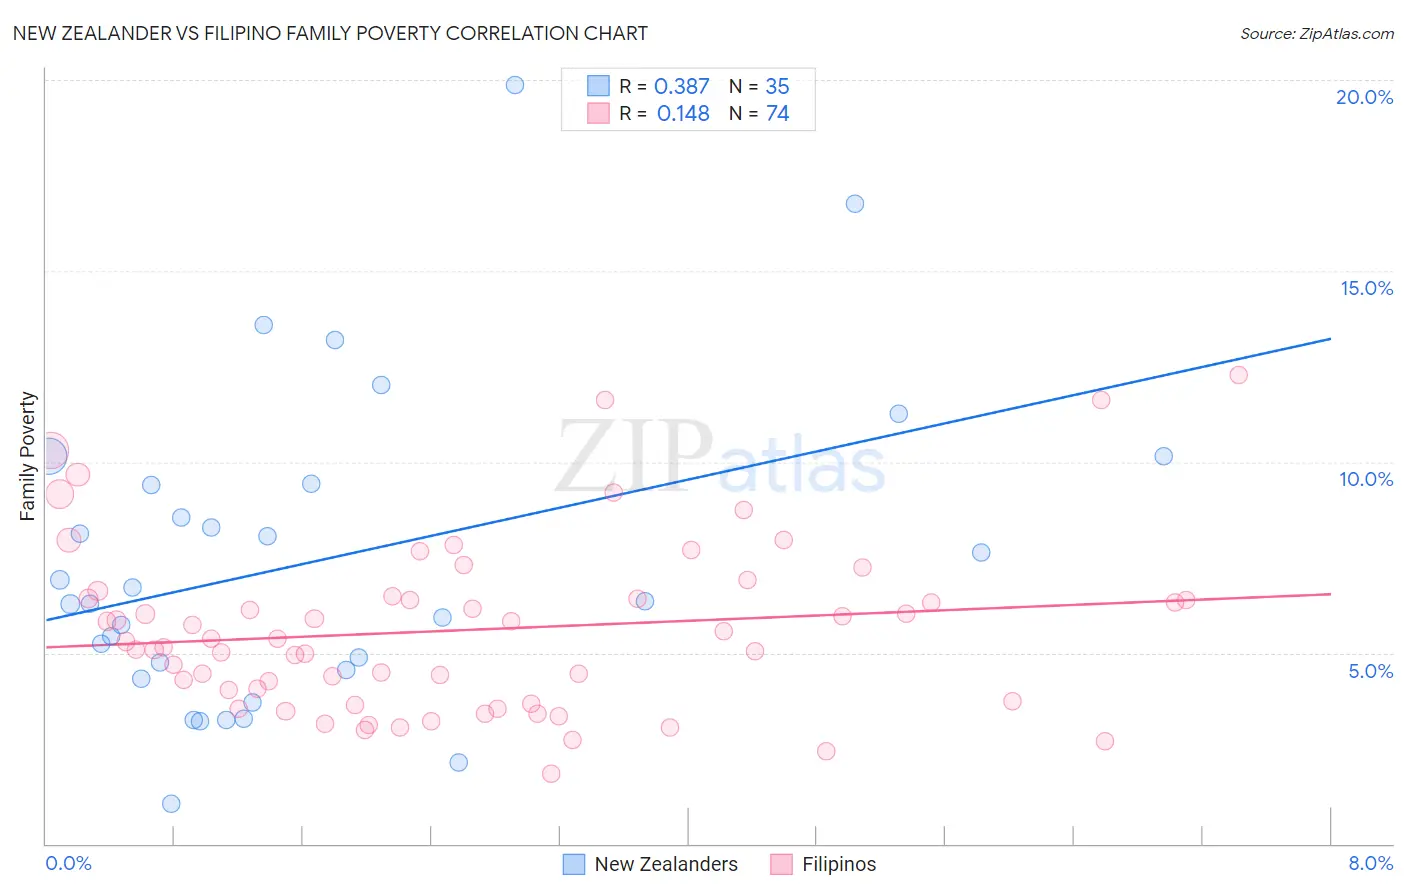
New Zealander vs Filipino Family Poverty Correlation Chart
The statistical analysis conducted on geographies consisting of 106,830,262 people shows a mild positive correlation between the proportion of New Zealanders and poverty level among families in the United States with a correlation coefficient (R) of 0.387 and weighted average of 8.1%. Similarly, the statistical analysis conducted on geographies consisting of 253,803,740 people shows a poor positive correlation between the proportion of Filipinos and poverty level among families in the United States with a correlation coefficient (R) of 0.148 and weighted average of 6.6%, a difference of 21.6%.
Family Poverty Correlation Summary
| Measurement | New Zealander | Filipino |
| Minimum | 1.0% | 1.8% |
| Maximum | 19.9% | 12.3% |
| Range | 18.8% | 10.4% |
| Mean | 7.4% | 5.6% |
| Median | 6.4% | 5.3% |
| Interquartile 25% (IQ1) | 4.6% | 3.7% |
| Interquartile 75% (IQ3) | 9.4% | 6.4% |
| Interquartile Range (IQR) | 4.9% | 2.7% |
| Standard Deviation (Sample) | 4.1% | 2.2% |
| Standard Deviation (Population) | 4.1% | 2.2% |
Similar Demographics by Family Poverty
Demographics Similar to New Zealanders by Family Poverty
In terms of family poverty, the demographic groups most similar to New Zealanders are Immigrants from Norway (8.1%, a difference of 0.030%), Immigrants from Indonesia (8.1%, a difference of 0.040%), Welsh (8.1%, a difference of 0.070%), Immigrants from Eastern Europe (8.1%, a difference of 0.13%), and Immigrants from South Africa (8.1%, a difference of 0.14%).
| Demographics | Rating | Rank | Family Poverty |
| Tlingit-Haida | 96.7 /100 | #93 | Exceptional 8.0% |
| Immigrants | Pakistan | 96.6 /100 | #94 | Exceptional 8.0% |
| Immigrants | Philippines | 96.5 /100 | #95 | Exceptional 8.0% |
| Immigrants | Turkey | 96.5 /100 | #96 | Exceptional 8.0% |
| Immigrants | Switzerland | 96.1 /100 | #97 | Exceptional 8.1% |
| Immigrants | South Africa | 95.9 /100 | #98 | Exceptional 8.1% |
| Welsh | 95.8 /100 | #99 | Exceptional 8.1% |
| New Zealanders | 95.8 /100 | #100 | Exceptional 8.1% |
| Immigrants | Norway | 95.7 /100 | #101 | Exceptional 8.1% |
| Immigrants | Indonesia | 95.7 /100 | #102 | Exceptional 8.1% |
| Immigrants | Eastern Europe | 95.6 /100 | #103 | Exceptional 8.1% |
| Slavs | 95.6 /100 | #104 | Exceptional 8.1% |
| Laotians | 95.6 /100 | #105 | Exceptional 8.1% |
| Egyptians | 95.1 /100 | #106 | Exceptional 8.1% |
| French Canadians | 95.0 /100 | #107 | Exceptional 8.1% |
Demographics Similar to Filipinos by Family Poverty
In terms of family poverty, the demographic groups most similar to Filipinos are Thai (6.7%, a difference of 0.57%), Immigrants from Taiwan (6.6%, a difference of 0.61%), Chinese (6.5%, a difference of 2.2%), Norwegian (6.9%, a difference of 3.6%), and Immigrants from Ireland (7.0%, a difference of 5.0%).
| Demographics | Rating | Rank | Family Poverty |
| Immigrants | India | 100.0 /100 | #1 | Exceptional 6.2% |
| Chinese | 100.0 /100 | #2 | Exceptional 6.5% |
| Immigrants | Taiwan | 100.0 /100 | #3 | Exceptional 6.6% |
| Filipinos | 100.0 /100 | #4 | Exceptional 6.6% |
| Thais | 100.0 /100 | #5 | Exceptional 6.7% |
| Norwegians | 99.9 /100 | #6 | Exceptional 6.9% |
| Immigrants | Ireland | 99.9 /100 | #7 | Exceptional 7.0% |
| Bhutanese | 99.9 /100 | #8 | Exceptional 7.0% |
| Latvians | 99.9 /100 | #9 | Exceptional 7.1% |
| Bulgarians | 99.8 /100 | #10 | Exceptional 7.1% |
| Immigrants | Singapore | 99.8 /100 | #11 | Exceptional 7.1% |
| Maltese | 99.8 /100 | #12 | Exceptional 7.1% |
| Swedes | 99.8 /100 | #13 | Exceptional 7.1% |
| Iranians | 99.8 /100 | #14 | Exceptional 7.1% |
| Lithuanians | 99.8 /100 | #15 | Exceptional 7.2% |