New Zealander vs Immigrants from Romania Family Poverty
COMPARE
New Zealander
Immigrants from Romania
Family Poverty
Family Poverty Comparison
New Zealanders
Immigrants from Romania
8.1%
FAMILY POVERTY
95.8/ 100
METRIC RATING
100th/ 347
METRIC RANK
7.8%
FAMILY POVERTY
98.2/ 100
METRIC RATING
72nd/ 347
METRIC RANK
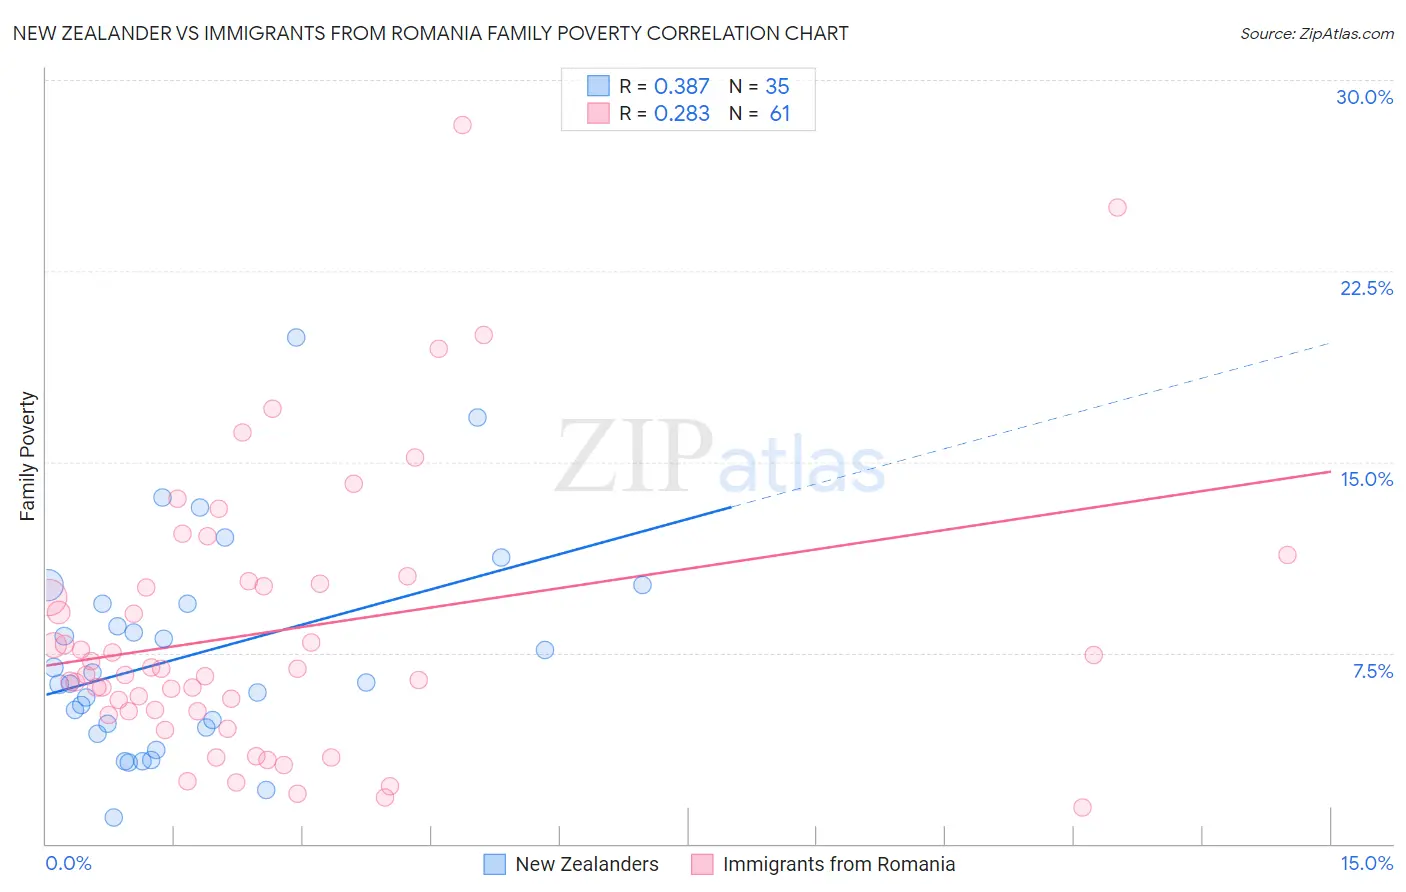
New Zealander vs Immigrants from Romania Family Poverty Correlation Chart
The statistical analysis conducted on geographies consisting of 106,830,262 people shows a mild positive correlation between the proportion of New Zealanders and poverty level among families in the United States with a correlation coefficient (R) of 0.387 and weighted average of 8.1%. Similarly, the statistical analysis conducted on geographies consisting of 256,635,029 people shows a weak positive correlation between the proportion of Immigrants from Romania and poverty level among families in the United States with a correlation coefficient (R) of 0.283 and weighted average of 7.8%, a difference of 3.3%.
Family Poverty Correlation Summary
| Measurement | New Zealander | Immigrants from Romania |
| Minimum | 1.0% | 1.4% |
| Maximum | 19.9% | 28.2% |
| Range | 18.8% | 26.8% |
| Mean | 7.4% | 8.4% |
| Median | 6.4% | 6.9% |
| Interquartile 25% (IQ1) | 4.6% | 5.2% |
| Interquartile 75% (IQ3) | 9.4% | 10.3% |
| Interquartile Range (IQR) | 4.9% | 5.1% |
| Standard Deviation (Sample) | 4.1% | 5.4% |
| Standard Deviation (Population) | 4.1% | 5.4% |
Similar Demographics by Family Poverty
Demographics Similar to New Zealanders by Family Poverty
In terms of family poverty, the demographic groups most similar to New Zealanders are Immigrants from Norway (8.1%, a difference of 0.030%), Immigrants from Indonesia (8.1%, a difference of 0.040%), Welsh (8.1%, a difference of 0.070%), Immigrants from Eastern Europe (8.1%, a difference of 0.13%), and Immigrants from South Africa (8.1%, a difference of 0.14%).
| Demographics | Rating | Rank | Family Poverty |
| Tlingit-Haida | 96.7 /100 | #93 | Exceptional 8.0% |
| Immigrants | Pakistan | 96.6 /100 | #94 | Exceptional 8.0% |
| Immigrants | Philippines | 96.5 /100 | #95 | Exceptional 8.0% |
| Immigrants | Turkey | 96.5 /100 | #96 | Exceptional 8.0% |
| Immigrants | Switzerland | 96.1 /100 | #97 | Exceptional 8.1% |
| Immigrants | South Africa | 95.9 /100 | #98 | Exceptional 8.1% |
| Welsh | 95.8 /100 | #99 | Exceptional 8.1% |
| New Zealanders | 95.8 /100 | #100 | Exceptional 8.1% |
| Immigrants | Norway | 95.7 /100 | #101 | Exceptional 8.1% |
| Immigrants | Indonesia | 95.7 /100 | #102 | Exceptional 8.1% |
| Immigrants | Eastern Europe | 95.6 /100 | #103 | Exceptional 8.1% |
| Slavs | 95.6 /100 | #104 | Exceptional 8.1% |
| Laotians | 95.6 /100 | #105 | Exceptional 8.1% |
| Egyptians | 95.1 /100 | #106 | Exceptional 8.1% |
| French Canadians | 95.0 /100 | #107 | Exceptional 8.1% |
Demographics Similar to Immigrants from Romania by Family Poverty
In terms of family poverty, the demographic groups most similar to Immigrants from Romania are Austrian (7.8%, a difference of 0.0%), Cambodian (7.8%, a difference of 0.060%), Immigrants from Canada (7.8%, a difference of 0.080%), Immigrants from China (7.8%, a difference of 0.080%), and Immigrants from Belgium (7.8%, a difference of 0.12%).
| Demographics | Rating | Rank | Family Poverty |
| Immigrants | Bulgaria | 98.3 /100 | #65 | Exceptional 7.8% |
| Dutch | 98.3 /100 | #66 | Exceptional 7.8% |
| Northern Europeans | 98.3 /100 | #67 | Exceptional 7.8% |
| Australians | 98.2 /100 | #68 | Exceptional 7.8% |
| Immigrants | Belgium | 98.2 /100 | #69 | Exceptional 7.8% |
| Immigrants | Canada | 98.2 /100 | #70 | Exceptional 7.8% |
| Cambodians | 98.2 /100 | #71 | Exceptional 7.8% |
| Immigrants | Romania | 98.2 /100 | #72 | Exceptional 7.8% |
| Austrians | 98.2 /100 | #73 | Exceptional 7.8% |
| Immigrants | China | 98.1 /100 | #74 | Exceptional 7.8% |
| Immigrants | Croatia | 98.1 /100 | #75 | Exceptional 7.8% |
| Immigrants | Latvia | 98.0 /100 | #76 | Exceptional 7.9% |
| Ukrainians | 98.0 /100 | #77 | Exceptional 7.9% |
| Immigrants | North America | 97.9 /100 | #78 | Exceptional 7.9% |
| Immigrants | Europe | 97.8 /100 | #79 | Exceptional 7.9% |