Navajo vs Immigrants from Nepal Family Poverty
COMPARE
Navajo
Immigrants from Nepal
Family Poverty
Family Poverty Comparison
Navajo
Immigrants from Nepal
18.8%
FAMILY POVERTY
0.0/ 100
METRIC RATING
345th/ 347
METRIC RANK
8.5%
FAMILY POVERTY
84.2/ 100
METRIC RATING
139th/ 347
METRIC RANK
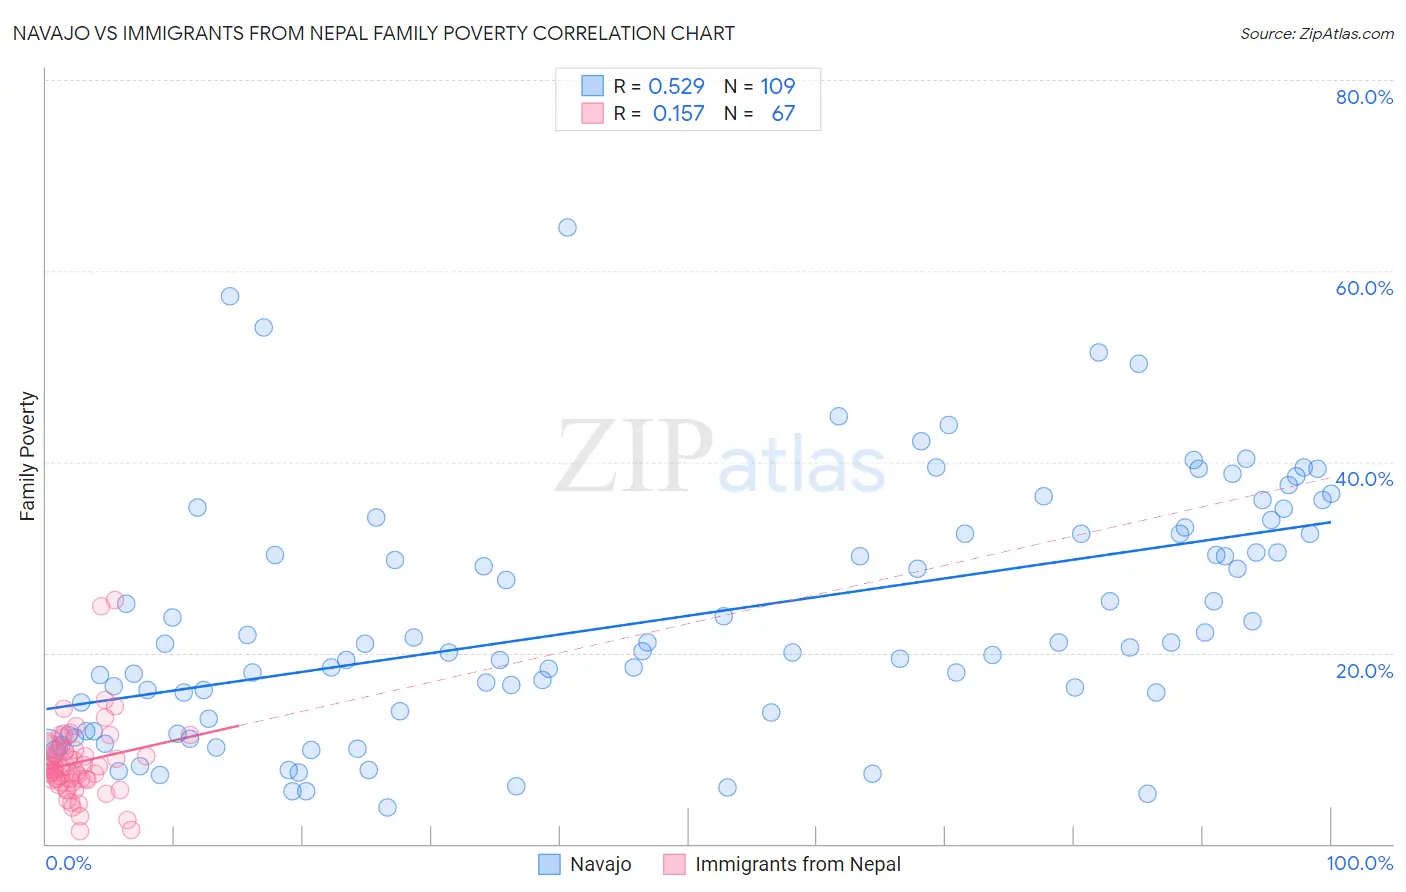
Navajo vs Immigrants from Nepal Family Poverty Correlation Chart
The statistical analysis conducted on geographies consisting of 224,626,486 people shows a substantial positive correlation between the proportion of Navajo and poverty level among families in the United States with a correlation coefficient (R) of 0.529 and weighted average of 18.8%. Similarly, the statistical analysis conducted on geographies consisting of 186,522,018 people shows a poor positive correlation between the proportion of Immigrants from Nepal and poverty level among families in the United States with a correlation coefficient (R) of 0.157 and weighted average of 8.5%, a difference of 120.9%.
Family Poverty Correlation Summary
| Measurement | Navajo | Immigrants from Nepal |
| Minimum | 3.8% | 1.3% |
| Maximum | 64.6% | 25.5% |
| Range | 60.8% | 24.2% |
| Mean | 23.5% | 8.5% |
| Median | 20.9% | 8.0% |
| Interquartile 25% (IQ1) | 13.4% | 6.6% |
| Interquartile 75% (IQ3) | 32.5% | 9.8% |
| Interquartile Range (IQR) | 19.1% | 3.2% |
| Standard Deviation (Sample) | 12.8% | 4.1% |
| Standard Deviation (Population) | 12.8% | 4.1% |
Similar Demographics by Family Poverty
Demographics Similar to Navajo by Family Poverty
In terms of family poverty, the demographic groups most similar to Navajo are Yup'ik (18.7%, a difference of 0.55%), Pima (18.4%, a difference of 2.4%), Immigrants from Yemen (17.5%, a difference of 7.7%), Puerto Rican (20.3%, a difference of 8.1%), and Tohono O'odham (20.4%, a difference of 8.5%).
| Demographics | Rating | Rank | Family Poverty |
| Immigrants | Dominican Republic | 0.0 /100 | #333 | Tragic 14.4% |
| Houma | 0.0 /100 | #334 | Tragic 14.6% |
| Apache | 0.0 /100 | #335 | Tragic 14.7% |
| Sioux | 0.0 /100 | #336 | Tragic 15.9% |
| Hopi | 0.0 /100 | #337 | Tragic 15.9% |
| Crow | 0.0 /100 | #338 | Tragic 16.1% |
| Yuman | 0.0 /100 | #339 | Tragic 16.6% |
| Pueblo | 0.0 /100 | #340 | Tragic 17.0% |
| Lumbee | 0.0 /100 | #341 | Tragic 17.0% |
| Immigrants | Yemen | 0.0 /100 | #342 | Tragic 17.5% |
| Pima | 0.0 /100 | #343 | Tragic 18.4% |
| Yup'ik | 0.0 /100 | #344 | Tragic 18.7% |
| Navajo | 0.0 /100 | #345 | Tragic 18.8% |
| Puerto Ricans | 0.0 /100 | #346 | Tragic 20.3% |
| Tohono O'odham | 0.0 /100 | #347 | Tragic 20.4% |
Demographics Similar to Immigrants from Nepal by Family Poverty
In terms of family poverty, the demographic groups most similar to Immigrants from Nepal are Immigrants from Kazakhstan (8.5%, a difference of 0.030%), Immigrants from Ukraine (8.5%, a difference of 0.060%), Armenian (8.5%, a difference of 0.12%), Yugoslavian (8.5%, a difference of 0.17%), and Immigrants from Germany (8.5%, a difference of 0.21%).
| Demographics | Rating | Rank | Family Poverty |
| Immigrants | Argentina | 88.2 /100 | #132 | Excellent 8.4% |
| Sri Lankans | 86.6 /100 | #133 | Excellent 8.5% |
| Chileans | 86.6 /100 | #134 | Excellent 8.5% |
| Immigrants | Malaysia | 86.5 /100 | #135 | Excellent 8.5% |
| Immigrants | Brazil | 86.3 /100 | #136 | Excellent 8.5% |
| Immigrants | Southern Europe | 86.0 /100 | #137 | Excellent 8.5% |
| Armenians | 84.6 /100 | #138 | Excellent 8.5% |
| Immigrants | Nepal | 84.2 /100 | #139 | Excellent 8.5% |
| Immigrants | Kazakhstan | 84.1 /100 | #140 | Excellent 8.5% |
| Immigrants | Ukraine | 83.9 /100 | #141 | Excellent 8.5% |
| Yugoslavians | 83.5 /100 | #142 | Excellent 8.5% |
| Immigrants | Germany | 83.3 /100 | #143 | Excellent 8.5% |
| Albanians | 83.3 /100 | #144 | Excellent 8.5% |
| Immigrants | South Eastern Asia | 83.2 /100 | #145 | Excellent 8.5% |
| Immigrants | Belarus | 83.2 /100 | #146 | Excellent 8.5% |