Navajo vs Immigrants from Nepal Unemployment Among Youth under 25 years
COMPARE
Navajo
Immigrants from Nepal
Unemployment Among Youth under 25 years
Unemployment Among Youth under 25 years Comparison
Navajo
Immigrants from Nepal
18.6%
UNEMPLOYMENT AMONG YOUTH UNDER 25 YEARS
0.0/ 100
METRIC RATING
343rd/ 347
METRIC RANK
10.8%
UNEMPLOYMENT AMONG YOUTH UNDER 25 YEARS
99.9/ 100
METRIC RATING
35th/ 347
METRIC RANK
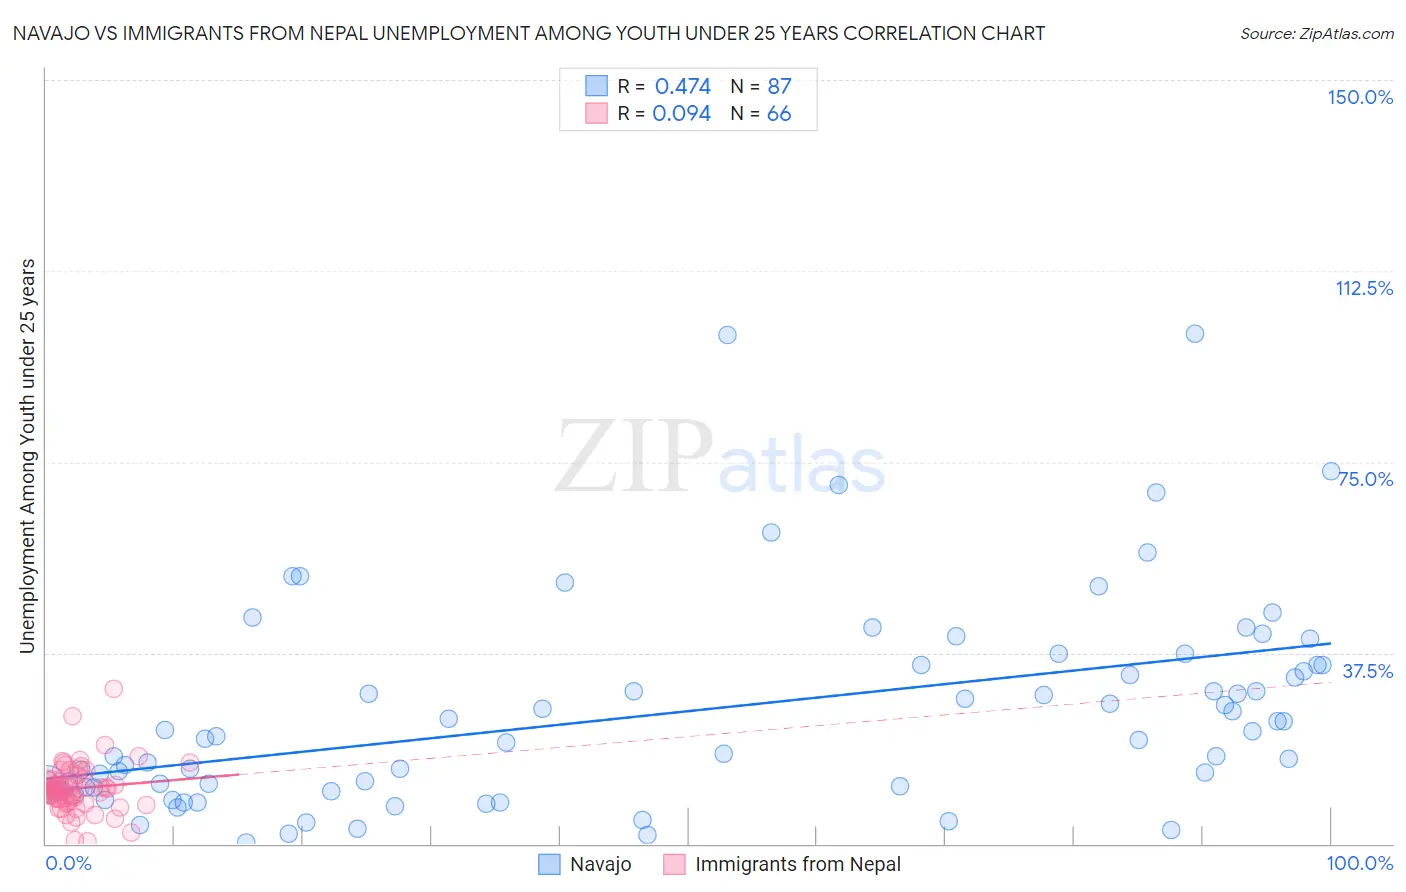
Navajo vs Immigrants from Nepal Unemployment Among Youth under 25 years Correlation Chart
The statistical analysis conducted on geographies consisting of 223,013,083 people shows a moderate positive correlation between the proportion of Navajo and unemployment rate among youth under the age of 25 in the United States with a correlation coefficient (R) of 0.474 and weighted average of 18.6%. Similarly, the statistical analysis conducted on geographies consisting of 186,127,349 people shows a slight positive correlation between the proportion of Immigrants from Nepal and unemployment rate among youth under the age of 25 in the United States with a correlation coefficient (R) of 0.094 and weighted average of 10.8%, a difference of 72.1%.
Unemployment Among Youth under 25 years Correlation Summary
| Measurement | Navajo | Immigrants from Nepal |
| Minimum | 0.30% | 0.50% |
| Maximum | 100.1% | 30.5% |
| Range | 99.8% | 30.0% |
| Mean | 25.7% | 10.9% |
| Median | 20.7% | 10.7% |
| Interquartile 25% (IQ1) | 11.1% | 8.3% |
| Interquartile 75% (IQ3) | 35.1% | 12.5% |
| Interquartile Range (IQR) | 24.0% | 4.2% |
| Standard Deviation (Sample) | 20.5% | 4.8% |
| Standard Deviation (Population) | 20.4% | 4.8% |
Similar Demographics by Unemployment Among Youth under 25 years
Demographics Similar to Navajo by Unemployment Among Youth under 25 years
In terms of unemployment among youth under 25 years, the demographic groups most similar to Navajo are Puerto Rican (18.4%, a difference of 1.2%), Paiute (17.6%, a difference of 6.0%), Crow (20.1%, a difference of 7.8%), Colville (16.8%, a difference of 11.1%), and Tsimshian (16.5%, a difference of 13.0%).
| Demographics | Rating | Rank | Unemployment Among Youth under 25 years |
| Guyanese | 0.0 /100 | #333 | Tragic 15.9% |
| Immigrants | Guyana | 0.0 /100 | #334 | Tragic 15.9% |
| Immigrants | St. Vincent and the Grenadines | 0.0 /100 | #335 | Tragic 16.1% |
| Pima | 0.0 /100 | #336 | Tragic 16.2% |
| Arapaho | 0.0 /100 | #337 | Tragic 16.3% |
| Yuman | 0.0 /100 | #338 | Tragic 16.3% |
| Tsimshian | 0.0 /100 | #339 | Tragic 16.5% |
| Colville | 0.0 /100 | #340 | Tragic 16.8% |
| Paiute | 0.0 /100 | #341 | Tragic 17.6% |
| Puerto Ricans | 0.0 /100 | #342 | Tragic 18.4% |
| Navajo | 0.0 /100 | #343 | Tragic 18.6% |
| Crow | 0.0 /100 | #344 | Tragic 20.1% |
| Hopi | 0.0 /100 | #345 | Tragic 21.5% |
| Inupiat | 0.0 /100 | #346 | Tragic 22.0% |
| Yup'ik | 0.0 /100 | #347 | Tragic 23.7% |
Demographics Similar to Immigrants from Nepal by Unemployment Among Youth under 25 years
In terms of unemployment among youth under 25 years, the demographic groups most similar to Immigrants from Nepal are English (10.8%, a difference of 0.080%), Hmong (10.8%, a difference of 0.13%), Immigrants from Zimbabwe (10.8%, a difference of 0.29%), European (10.8%, a difference of 0.35%), and Immigrants from Congo (10.9%, a difference of 0.36%).
| Demographics | Rating | Rank | Unemployment Among Youth under 25 years |
| Somalis | 100.0 /100 | #28 | Exceptional 10.7% |
| Chinese | 99.9 /100 | #29 | Exceptional 10.7% |
| Osage | 99.9 /100 | #30 | Exceptional 10.7% |
| Slovenes | 99.9 /100 | #31 | Exceptional 10.7% |
| Taiwanese | 99.9 /100 | #32 | Exceptional 10.8% |
| Europeans | 99.9 /100 | #33 | Exceptional 10.8% |
| English | 99.9 /100 | #34 | Exceptional 10.8% |
| Immigrants | Nepal | 99.9 /100 | #35 | Exceptional 10.8% |
| Hmong | 99.8 /100 | #36 | Exceptional 10.8% |
| Immigrants | Zimbabwe | 99.8 /100 | #37 | Exceptional 10.8% |
| Immigrants | Congo | 99.8 /100 | #38 | Exceptional 10.9% |
| Immigrants | Zaire | 99.8 /100 | #39 | Exceptional 10.9% |
| Scottish | 99.8 /100 | #40 | Exceptional 10.9% |
| Croatians | 99.8 /100 | #41 | Exceptional 10.9% |
| Cambodians | 99.7 /100 | #42 | Exceptional 10.9% |