Paiute vs Immigrants from Nepal Family Poverty
COMPARE
Paiute
Immigrants from Nepal
Family Poverty
Family Poverty Comparison
Paiute
Immigrants from Nepal
13.0%
FAMILY POVERTY
0.0/ 100
METRIC RATING
325th/ 347
METRIC RANK
8.5%
FAMILY POVERTY
84.2/ 100
METRIC RATING
139th/ 347
METRIC RANK
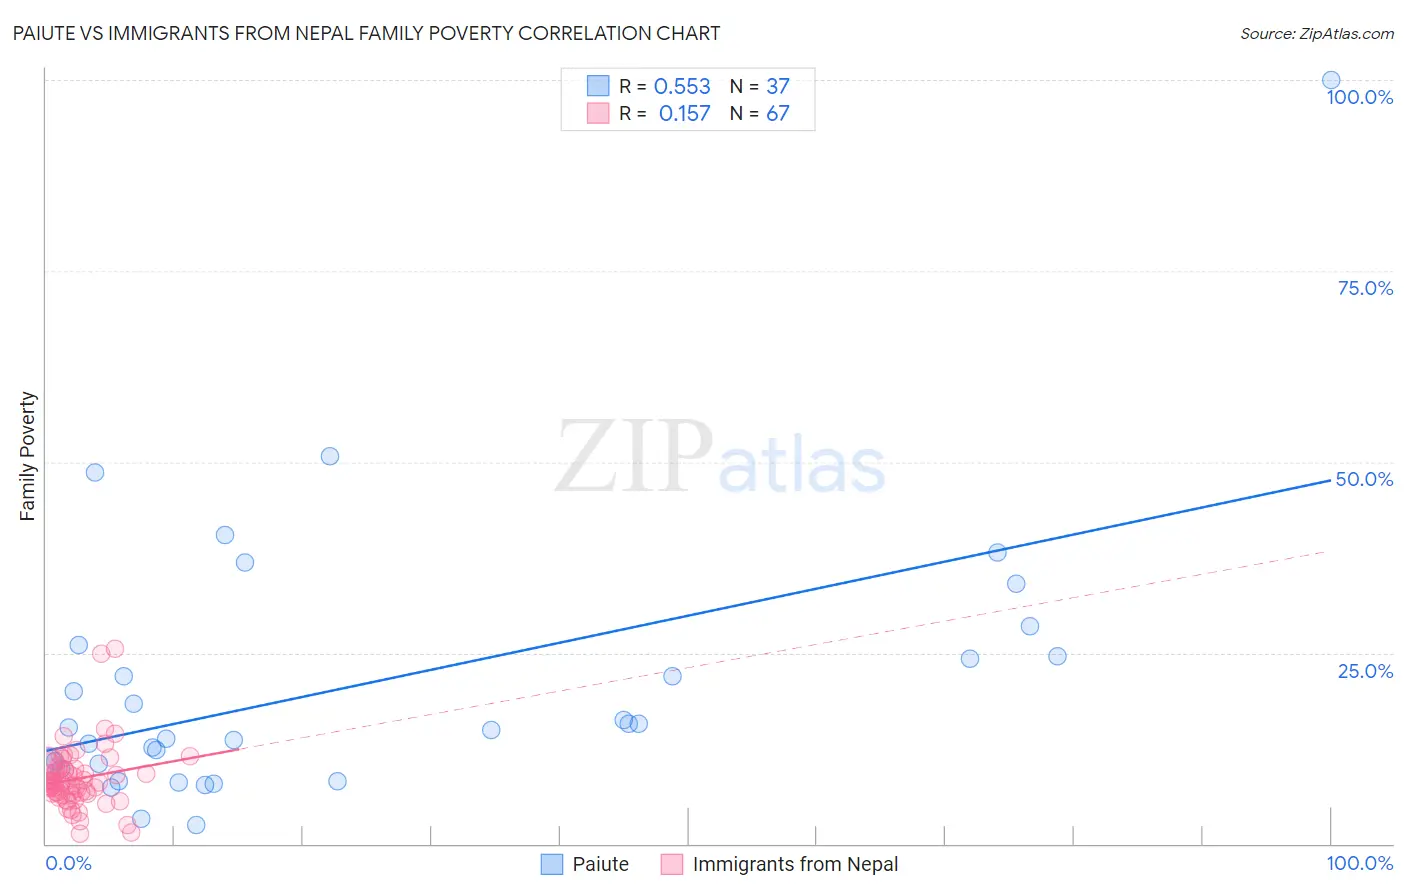
Paiute vs Immigrants from Nepal Family Poverty Correlation Chart
The statistical analysis conducted on geographies consisting of 58,372,907 people shows a substantial positive correlation between the proportion of Paiute and poverty level among families in the United States with a correlation coefficient (R) of 0.553 and weighted average of 13.0%. Similarly, the statistical analysis conducted on geographies consisting of 186,522,018 people shows a poor positive correlation between the proportion of Immigrants from Nepal and poverty level among families in the United States with a correlation coefficient (R) of 0.157 and weighted average of 8.5%, a difference of 52.6%.
Family Poverty Correlation Summary
| Measurement | Paiute | Immigrants from Nepal |
| Minimum | 2.4% | 1.3% |
| Maximum | 100.0% | 25.5% |
| Range | 97.6% | 24.2% |
| Mean | 20.9% | 8.5% |
| Median | 15.2% | 8.0% |
| Interquartile 25% (IQ1) | 10.1% | 6.6% |
| Interquartile 75% (IQ3) | 25.3% | 9.8% |
| Interquartile Range (IQR) | 15.2% | 3.2% |
| Standard Deviation (Sample) | 18.0% | 4.1% |
| Standard Deviation (Population) | 17.8% | 4.1% |
Similar Demographics by Family Poverty
Demographics Similar to Paiute by Family Poverty
In terms of family poverty, the demographic groups most similar to Paiute are Colville (13.0%, a difference of 0.060%), Yakama (13.1%, a difference of 0.75%), Immigrants from Dominica (12.7%, a difference of 2.0%), Menominee (12.7%, a difference of 2.0%), and Central American Indian (13.3%, a difference of 2.4%).
| Demographics | Rating | Rank | Family Poverty |
| U.S. Virgin Islanders | 0.0 /100 | #318 | Tragic 12.4% |
| British West Indians | 0.0 /100 | #319 | Tragic 12.4% |
| Inupiat | 0.0 /100 | #320 | Tragic 12.5% |
| Arapaho | 0.0 /100 | #321 | Tragic 12.7% |
| Immigrants | Honduras | 0.0 /100 | #322 | Tragic 12.7% |
| Menominee | 0.0 /100 | #323 | Tragic 12.7% |
| Immigrants | Dominica | 0.0 /100 | #324 | Tragic 12.7% |
| Paiute | 0.0 /100 | #325 | Tragic 13.0% |
| Colville | 0.0 /100 | #326 | Tragic 13.0% |
| Yakama | 0.0 /100 | #327 | Tragic 13.1% |
| Central American Indians | 0.0 /100 | #328 | Tragic 13.3% |
| Blacks/African Americans | 0.0 /100 | #329 | Tragic 13.3% |
| Natives/Alaskans | 0.0 /100 | #330 | Tragic 14.3% |
| Cheyenne | 0.0 /100 | #331 | Tragic 14.3% |
| Dominicans | 0.0 /100 | #332 | Tragic 14.3% |
Demographics Similar to Immigrants from Nepal by Family Poverty
In terms of family poverty, the demographic groups most similar to Immigrants from Nepal are Immigrants from Kazakhstan (8.5%, a difference of 0.030%), Immigrants from Ukraine (8.5%, a difference of 0.060%), Armenian (8.5%, a difference of 0.12%), Yugoslavian (8.5%, a difference of 0.17%), and Immigrants from Germany (8.5%, a difference of 0.21%).
| Demographics | Rating | Rank | Family Poverty |
| Immigrants | Argentina | 88.2 /100 | #132 | Excellent 8.4% |
| Sri Lankans | 86.6 /100 | #133 | Excellent 8.5% |
| Chileans | 86.6 /100 | #134 | Excellent 8.5% |
| Immigrants | Malaysia | 86.5 /100 | #135 | Excellent 8.5% |
| Immigrants | Brazil | 86.3 /100 | #136 | Excellent 8.5% |
| Immigrants | Southern Europe | 86.0 /100 | #137 | Excellent 8.5% |
| Armenians | 84.6 /100 | #138 | Excellent 8.5% |
| Immigrants | Nepal | 84.2 /100 | #139 | Excellent 8.5% |
| Immigrants | Kazakhstan | 84.1 /100 | #140 | Excellent 8.5% |
| Immigrants | Ukraine | 83.9 /100 | #141 | Excellent 8.5% |
| Yugoslavians | 83.5 /100 | #142 | Excellent 8.5% |
| Immigrants | Germany | 83.3 /100 | #143 | Excellent 8.5% |
| Albanians | 83.3 /100 | #144 | Excellent 8.5% |
| Immigrants | South Eastern Asia | 83.2 /100 | #145 | Excellent 8.5% |
| Immigrants | Belarus | 83.2 /100 | #146 | Excellent 8.5% |