Native Hawaiian vs Immigrants from Cuba Female Poverty Among 25-34 Year Olds
COMPARE
Native Hawaiian
Immigrants from Cuba
Female Poverty Among 25-34 Year Olds
Female Poverty Among 25-34 Year Olds Comparison
Native Hawaiians
Immigrants from Cuba
13.2%
FEMALE POVERTY AMONG 25-34 YEAR OLDS
78.9/ 100
METRIC RATING
144th/ 347
METRIC RANK
15.2%
FEMALE POVERTY AMONG 25-34 YEAR OLDS
0.2/ 100
METRIC RATING
259th/ 347
METRIC RANK
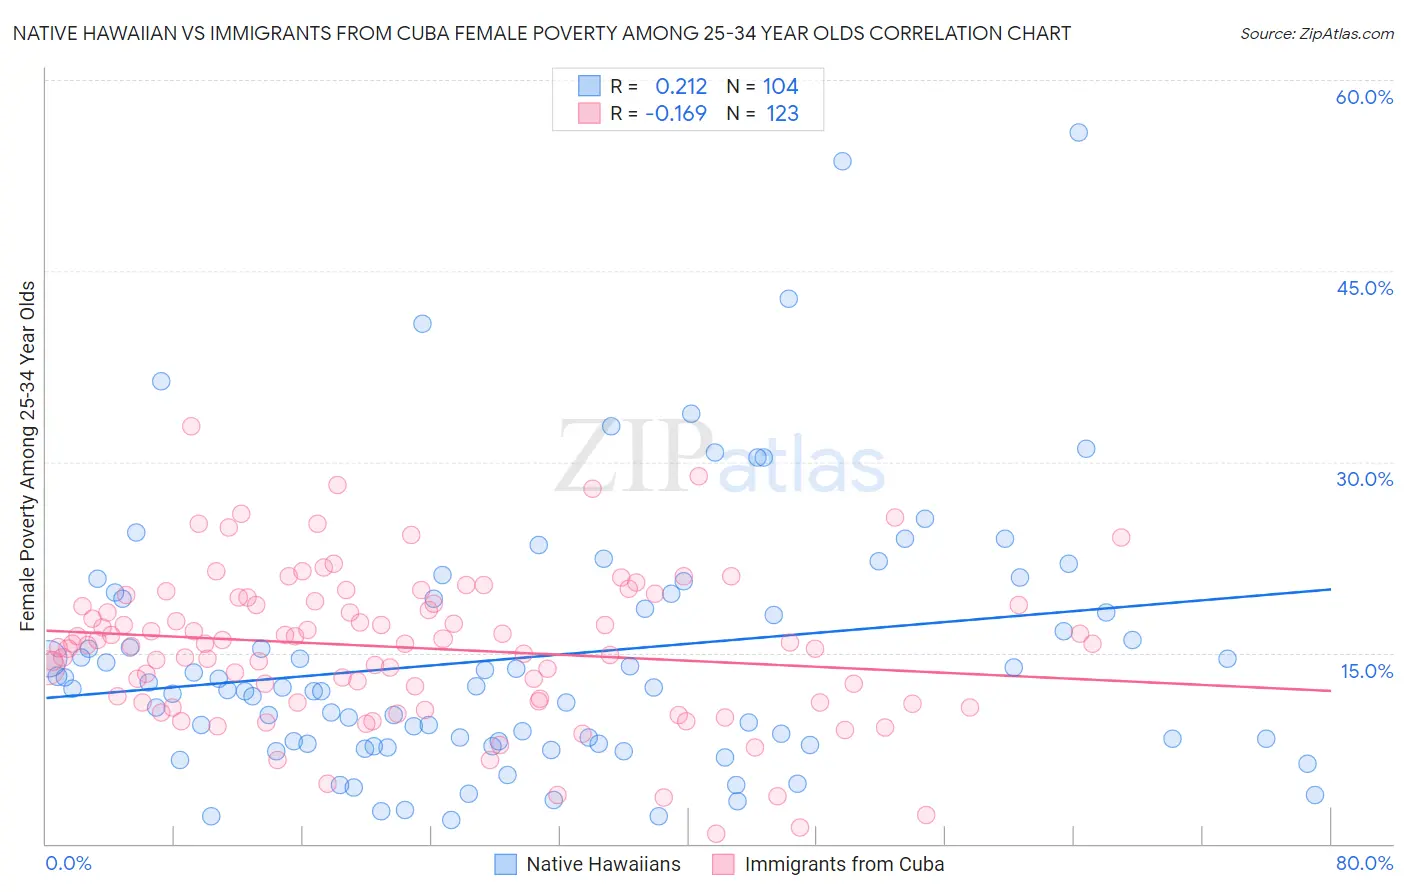
Native Hawaiian vs Immigrants from Cuba Female Poverty Among 25-34 Year Olds Correlation Chart
The statistical analysis conducted on geographies consisting of 328,500,665 people shows a weak positive correlation between the proportion of Native Hawaiians and poverty level among females between the ages 25 and 34 in the United States with a correlation coefficient (R) of 0.212 and weighted average of 13.2%. Similarly, the statistical analysis conducted on geographies consisting of 321,983,210 people shows a poor negative correlation between the proportion of Immigrants from Cuba and poverty level among females between the ages 25 and 34 in the United States with a correlation coefficient (R) of -0.169 and weighted average of 15.2%, a difference of 15.7%.
Female Poverty Among 25-34 Year Olds Correlation Summary
| Measurement | Native Hawaiian | Immigrants from Cuba |
| Minimum | 1.8% | 0.81% |
| Maximum | 55.9% | 32.8% |
| Range | 54.0% | 32.0% |
| Mean | 14.7% | 15.4% |
| Median | 12.2% | 15.7% |
| Interquartile 25% (IQ1) | 7.8% | 11.1% |
| Interquartile 75% (IQ3) | 19.2% | 19.1% |
| Interquartile Range (IQR) | 11.4% | 8.0% |
| Standard Deviation (Sample) | 10.3% | 5.9% |
| Standard Deviation (Population) | 10.2% | 5.8% |
Similar Demographics by Female Poverty Among 25-34 Year Olds
Demographics Similar to Native Hawaiians by Female Poverty Among 25-34 Year Olds
In terms of female poverty among 25-34 year olds, the demographic groups most similar to Native Hawaiians are Colombian (13.2%, a difference of 0.21%), South American (13.2%, a difference of 0.25%), European (13.2%, a difference of 0.26%), Lebanese (13.2%, a difference of 0.26%), and Sierra Leonean (13.2%, a difference of 0.32%).
| Demographics | Rating | Rank | Female Poverty Among 25-34 Year Olds |
| Immigrants | Chile | 84.6 /100 | #137 | Excellent 13.1% |
| Brazilians | 84.5 /100 | #138 | Excellent 13.1% |
| Austrians | 83.7 /100 | #139 | Excellent 13.1% |
| Immigrants | Iraq | 83.6 /100 | #140 | Excellent 13.1% |
| New Zealanders | 83.4 /100 | #141 | Excellent 13.1% |
| Scandinavians | 82.3 /100 | #142 | Excellent 13.1% |
| Israelis | 81.9 /100 | #143 | Excellent 13.1% |
| Native Hawaiians | 78.9 /100 | #144 | Good 13.2% |
| Colombians | 77.2 /100 | #145 | Good 13.2% |
| South Americans | 76.9 /100 | #146 | Good 13.2% |
| Europeans | 76.8 /100 | #147 | Good 13.2% |
| Lebanese | 76.8 /100 | #148 | Good 13.2% |
| Sierra Leoneans | 76.3 /100 | #149 | Good 13.2% |
| Iraqis | 76.0 /100 | #150 | Good 13.2% |
| Costa Ricans | 75.8 /100 | #151 | Good 13.2% |
Demographics Similar to Immigrants from Cuba by Female Poverty Among 25-34 Year Olds
In terms of female poverty among 25-34 year olds, the demographic groups most similar to Immigrants from Cuba are Nepalese (15.2%, a difference of 0.020%), Immigrants from Burma/Myanmar (15.2%, a difference of 0.28%), West Indian (15.2%, a difference of 0.30%), Marshallese (15.3%, a difference of 0.37%), and Immigrants from Laos (15.2%, a difference of 0.47%).
| Demographics | Rating | Rank | Female Poverty Among 25-34 Year Olds |
| Belizeans | 0.4 /100 | #252 | Tragic 15.1% |
| Immigrants | West Indies | 0.4 /100 | #253 | Tragic 15.1% |
| Somalis | 0.4 /100 | #254 | Tragic 15.1% |
| Immigrants | Laos | 0.3 /100 | #255 | Tragic 15.2% |
| West Indians | 0.3 /100 | #256 | Tragic 15.2% |
| Immigrants | Burma/Myanmar | 0.3 /100 | #257 | Tragic 15.2% |
| Nepalese | 0.2 /100 | #258 | Tragic 15.2% |
| Immigrants | Cuba | 0.2 /100 | #259 | Tragic 15.2% |
| Marshallese | 0.2 /100 | #260 | Tragic 15.3% |
| Liberians | 0.2 /100 | #261 | Tragic 15.3% |
| Immigrants | Belize | 0.2 /100 | #262 | Tragic 15.3% |
| Mexican American Indians | 0.2 /100 | #263 | Tragic 15.4% |
| Pennsylvania Germans | 0.1 /100 | #264 | Tragic 15.4% |
| Immigrants | Liberia | 0.1 /100 | #265 | Tragic 15.4% |
| Immigrants | Somalia | 0.1 /100 | #266 | Tragic 15.4% |