Native Hawaiian vs Immigrants from Austria Female Poverty Among 25-34 Year Olds
COMPARE
Native Hawaiian
Immigrants from Austria
Female Poverty Among 25-34 Year Olds
Female Poverty Among 25-34 Year Olds Comparison
Native Hawaiians
Immigrants from Austria
13.2%
FEMALE POVERTY AMONG 25-34 YEAR OLDS
78.9/ 100
METRIC RATING
144th/ 347
METRIC RANK
12.5%
FEMALE POVERTY AMONG 25-34 YEAR OLDS
97.4/ 100
METRIC RATING
88th/ 347
METRIC RANK
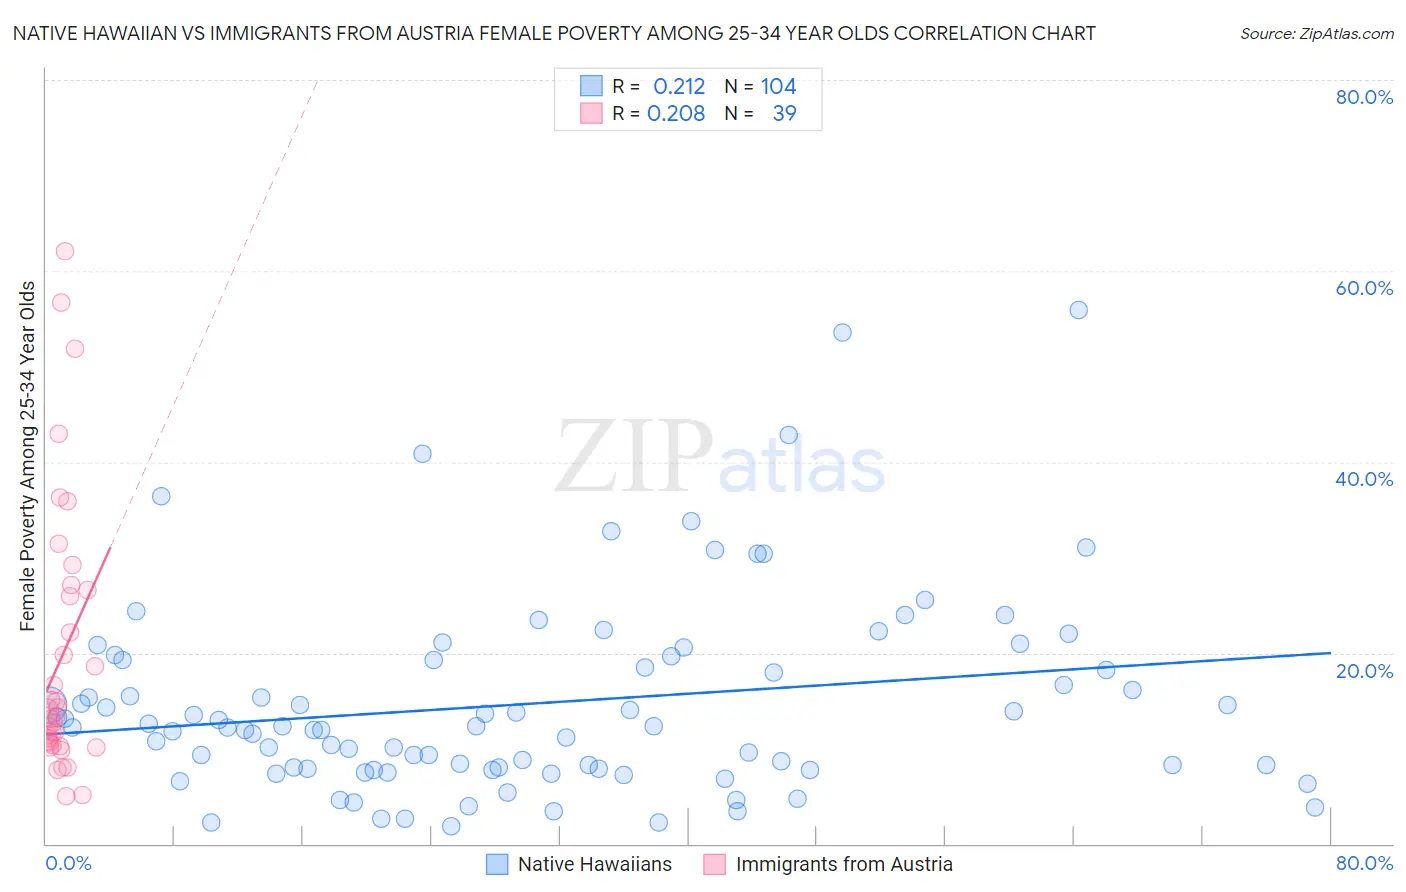
Native Hawaiian vs Immigrants from Austria Female Poverty Among 25-34 Year Olds Correlation Chart
The statistical analysis conducted on geographies consisting of 328,500,665 people shows a weak positive correlation between the proportion of Native Hawaiians and poverty level among females between the ages 25 and 34 in the United States with a correlation coefficient (R) of 0.212 and weighted average of 13.2%. Similarly, the statistical analysis conducted on geographies consisting of 166,374,239 people shows a weak positive correlation between the proportion of Immigrants from Austria and poverty level among females between the ages 25 and 34 in the United States with a correlation coefficient (R) of 0.208 and weighted average of 12.5%, a difference of 5.2%.
Female Poverty Among 25-34 Year Olds Correlation Summary
| Measurement | Native Hawaiian | Immigrants from Austria |
| Minimum | 1.8% | 5.0% |
| Maximum | 55.9% | 62.1% |
| Range | 54.0% | 57.0% |
| Mean | 14.7% | 19.6% |
| Median | 12.2% | 13.3% |
| Interquartile 25% (IQ1) | 7.8% | 10.3% |
| Interquartile 75% (IQ3) | 19.2% | 26.5% |
| Interquartile Range (IQR) | 11.4% | 16.2% |
| Standard Deviation (Sample) | 10.3% | 14.2% |
| Standard Deviation (Population) | 10.2% | 14.1% |
Similar Demographics by Female Poverty Among 25-34 Year Olds
Demographics Similar to Native Hawaiians by Female Poverty Among 25-34 Year Olds
In terms of female poverty among 25-34 year olds, the demographic groups most similar to Native Hawaiians are Colombian (13.2%, a difference of 0.21%), South American (13.2%, a difference of 0.25%), European (13.2%, a difference of 0.26%), Lebanese (13.2%, a difference of 0.26%), and Sierra Leonean (13.2%, a difference of 0.32%).
| Demographics | Rating | Rank | Female Poverty Among 25-34 Year Olds |
| Immigrants | Chile | 84.6 /100 | #137 | Excellent 13.1% |
| Brazilians | 84.5 /100 | #138 | Excellent 13.1% |
| Austrians | 83.7 /100 | #139 | Excellent 13.1% |
| Immigrants | Iraq | 83.6 /100 | #140 | Excellent 13.1% |
| New Zealanders | 83.4 /100 | #141 | Excellent 13.1% |
| Scandinavians | 82.3 /100 | #142 | Excellent 13.1% |
| Israelis | 81.9 /100 | #143 | Excellent 13.1% |
| Native Hawaiians | 78.9 /100 | #144 | Good 13.2% |
| Colombians | 77.2 /100 | #145 | Good 13.2% |
| South Americans | 76.9 /100 | #146 | Good 13.2% |
| Europeans | 76.8 /100 | #147 | Good 13.2% |
| Lebanese | 76.8 /100 | #148 | Good 13.2% |
| Sierra Leoneans | 76.3 /100 | #149 | Good 13.2% |
| Iraqis | 76.0 /100 | #150 | Good 13.2% |
| Costa Ricans | 75.8 /100 | #151 | Good 13.2% |
Demographics Similar to Immigrants from Austria by Female Poverty Among 25-34 Year Olds
In terms of female poverty among 25-34 year olds, the demographic groups most similar to Immigrants from Austria are Argentinean (12.5%, a difference of 0.070%), Croatian (12.5%, a difference of 0.10%), Immigrants from South Eastern Asia (12.5%, a difference of 0.11%), Italian (12.5%, a difference of 0.17%), and Immigrants from Latvia (12.5%, a difference of 0.23%).
| Demographics | Rating | Rank | Female Poverty Among 25-34 Year Olds |
| Immigrants | Kazakhstan | 98.1 /100 | #81 | Exceptional 12.4% |
| Ethiopians | 98.0 /100 | #82 | Exceptional 12.4% |
| Albanians | 97.7 /100 | #83 | Exceptional 12.5% |
| Immigrants | Latvia | 97.7 /100 | #84 | Exceptional 12.5% |
| Immigrants | South Eastern Asia | 97.6 /100 | #85 | Exceptional 12.5% |
| Croatians | 97.5 /100 | #86 | Exceptional 12.5% |
| Argentineans | 97.5 /100 | #87 | Exceptional 12.5% |
| Immigrants | Austria | 97.4 /100 | #88 | Exceptional 12.5% |
| Italians | 97.2 /100 | #89 | Exceptional 12.5% |
| Immigrants | Albania | 97.1 /100 | #90 | Exceptional 12.5% |
| Norwegians | 96.9 /100 | #91 | Exceptional 12.6% |
| Immigrants | Armenia | 96.9 /100 | #92 | Exceptional 12.6% |
| Palestinians | 96.9 /100 | #93 | Exceptional 12.6% |
| Immigrants | France | 96.8 /100 | #94 | Exceptional 12.6% |
| Ukrainians | 96.7 /100 | #95 | Exceptional 12.6% |