Native Hawaiian vs Cherokee Female Poverty Among 25-34 Year Olds
COMPARE
Native Hawaiian
Cherokee
Female Poverty Among 25-34 Year Olds
Female Poverty Among 25-34 Year Olds Comparison
Native Hawaiians
Cherokee
13.2%
FEMALE POVERTY AMONG 25-34 YEAR OLDS
78.9/ 100
METRIC RATING
144th/ 347
METRIC RANK
17.2%
FEMALE POVERTY AMONG 25-34 YEAR OLDS
0.0/ 100
METRIC RATING
310th/ 347
METRIC RANK
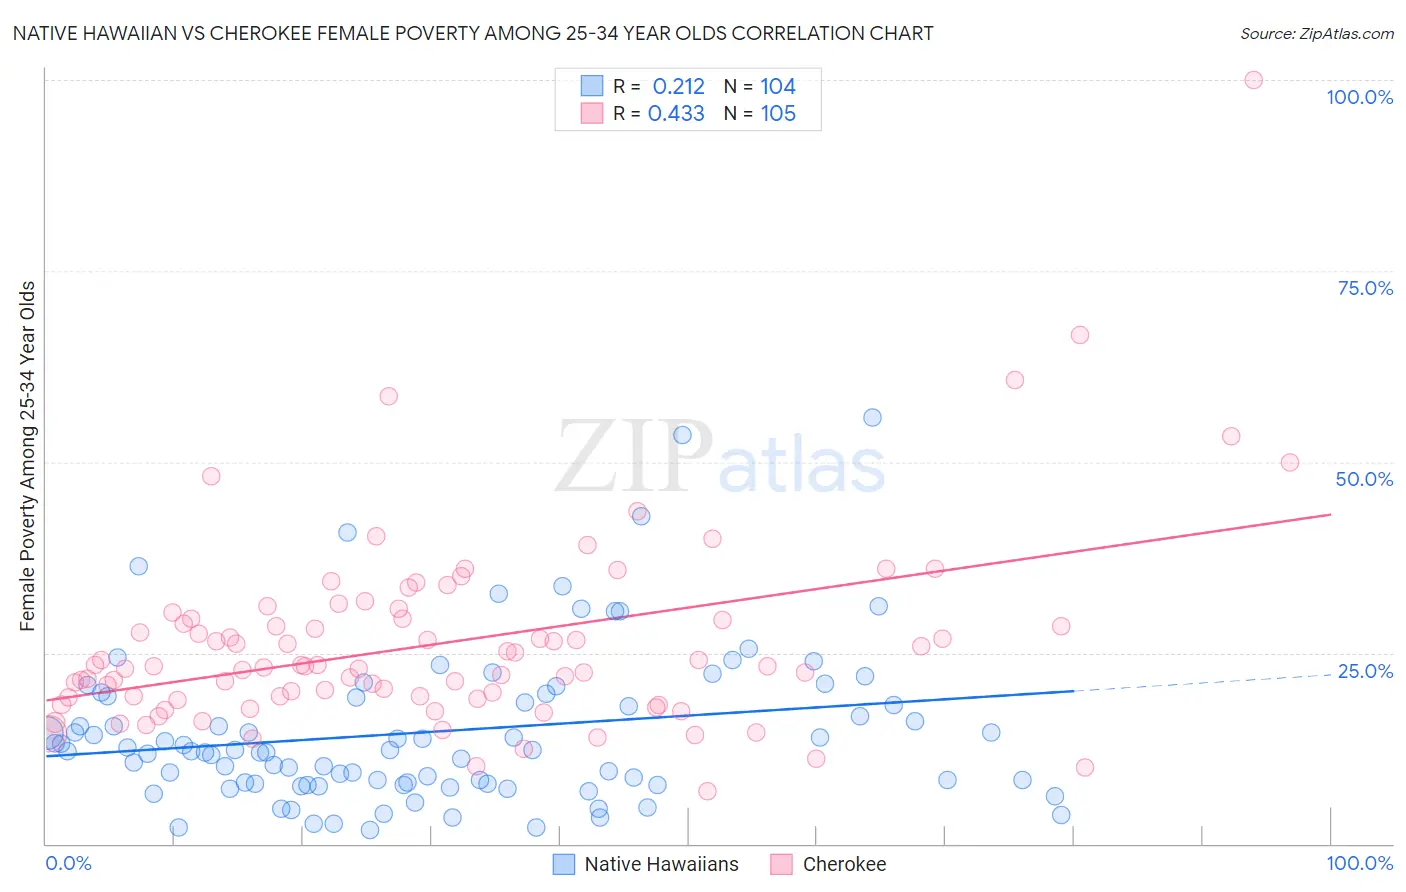
Native Hawaiian vs Cherokee Female Poverty Among 25-34 Year Olds Correlation Chart
The statistical analysis conducted on geographies consisting of 328,500,665 people shows a weak positive correlation between the proportion of Native Hawaiians and poverty level among females between the ages 25 and 34 in the United States with a correlation coefficient (R) of 0.212 and weighted average of 13.2%. Similarly, the statistical analysis conducted on geographies consisting of 483,649,449 people shows a moderate positive correlation between the proportion of Cherokee and poverty level among females between the ages 25 and 34 in the United States with a correlation coefficient (R) of 0.433 and weighted average of 17.2%, a difference of 30.5%.
Female Poverty Among 25-34 Year Olds Correlation Summary
| Measurement | Native Hawaiian | Cherokee |
| Minimum | 1.8% | 6.9% |
| Maximum | 55.9% | 100.0% |
| Range | 54.0% | 93.1% |
| Mean | 14.7% | 26.3% |
| Median | 12.2% | 23.3% |
| Interquartile 25% (IQ1) | 7.8% | 19.1% |
| Interquartile 75% (IQ3) | 19.2% | 29.5% |
| Interquartile Range (IQR) | 11.4% | 10.4% |
| Standard Deviation (Sample) | 10.3% | 12.8% |
| Standard Deviation (Population) | 10.2% | 12.7% |
Similar Demographics by Female Poverty Among 25-34 Year Olds
Demographics Similar to Native Hawaiians by Female Poverty Among 25-34 Year Olds
In terms of female poverty among 25-34 year olds, the demographic groups most similar to Native Hawaiians are Colombian (13.2%, a difference of 0.21%), South American (13.2%, a difference of 0.25%), European (13.2%, a difference of 0.26%), Lebanese (13.2%, a difference of 0.26%), and Sierra Leonean (13.2%, a difference of 0.32%).
| Demographics | Rating | Rank | Female Poverty Among 25-34 Year Olds |
| Immigrants | Chile | 84.6 /100 | #137 | Excellent 13.1% |
| Brazilians | 84.5 /100 | #138 | Excellent 13.1% |
| Austrians | 83.7 /100 | #139 | Excellent 13.1% |
| Immigrants | Iraq | 83.6 /100 | #140 | Excellent 13.1% |
| New Zealanders | 83.4 /100 | #141 | Excellent 13.1% |
| Scandinavians | 82.3 /100 | #142 | Excellent 13.1% |
| Israelis | 81.9 /100 | #143 | Excellent 13.1% |
| Native Hawaiians | 78.9 /100 | #144 | Good 13.2% |
| Colombians | 77.2 /100 | #145 | Good 13.2% |
| South Americans | 76.9 /100 | #146 | Good 13.2% |
| Europeans | 76.8 /100 | #147 | Good 13.2% |
| Lebanese | 76.8 /100 | #148 | Good 13.2% |
| Sierra Leoneans | 76.3 /100 | #149 | Good 13.2% |
| Iraqis | 76.0 /100 | #150 | Good 13.2% |
| Costa Ricans | 75.8 /100 | #151 | Good 13.2% |
Demographics Similar to Cherokee by Female Poverty Among 25-34 Year Olds
In terms of female poverty among 25-34 year olds, the demographic groups most similar to Cherokee are Ottawa (17.1%, a difference of 0.47%), Immigrants from Honduras (17.3%, a difference of 0.48%), African (17.0%, a difference of 0.77%), Yaqui (17.0%, a difference of 0.98%), and Chickasaw (17.0%, a difference of 0.99%).
| Demographics | Rating | Rank | Female Poverty Among 25-34 Year Olds |
| Immigrants | Mexico | 0.0 /100 | #303 | Tragic 16.8% |
| Hondurans | 0.0 /100 | #304 | Tragic 16.9% |
| Immigrants | Cabo Verde | 0.0 /100 | #305 | Tragic 16.9% |
| Chickasaw | 0.0 /100 | #306 | Tragic 17.0% |
| Yaqui | 0.0 /100 | #307 | Tragic 17.0% |
| Africans | 0.0 /100 | #308 | Tragic 17.0% |
| Ottawa | 0.0 /100 | #309 | Tragic 17.1% |
| Cherokee | 0.0 /100 | #310 | Tragic 17.2% |
| Immigrants | Honduras | 0.0 /100 | #311 | Tragic 17.3% |
| Iroquois | 0.0 /100 | #312 | Tragic 17.5% |
| Colville | 0.0 /100 | #313 | Tragic 17.5% |
| Immigrants | Dominican Republic | 0.0 /100 | #314 | Tragic 17.6% |
| Yakama | 0.0 /100 | #315 | Tragic 17.6% |
| Dominicans | 0.0 /100 | #316 | Tragic 17.6% |
| Arapaho | 0.0 /100 | #317 | Tragic 17.8% |