English vs Immigrants from Cuba Female Poverty Among 25-34 Year Olds
COMPARE
English
Immigrants from Cuba
Female Poverty Among 25-34 Year Olds
Female Poverty Among 25-34 Year Olds Comparison
English
Immigrants from Cuba
13.9%
FEMALE POVERTY AMONG 25-34 YEAR OLDS
20.4/ 100
METRIC RATING
199th/ 347
METRIC RANK
15.2%
FEMALE POVERTY AMONG 25-34 YEAR OLDS
0.2/ 100
METRIC RATING
259th/ 347
METRIC RANK
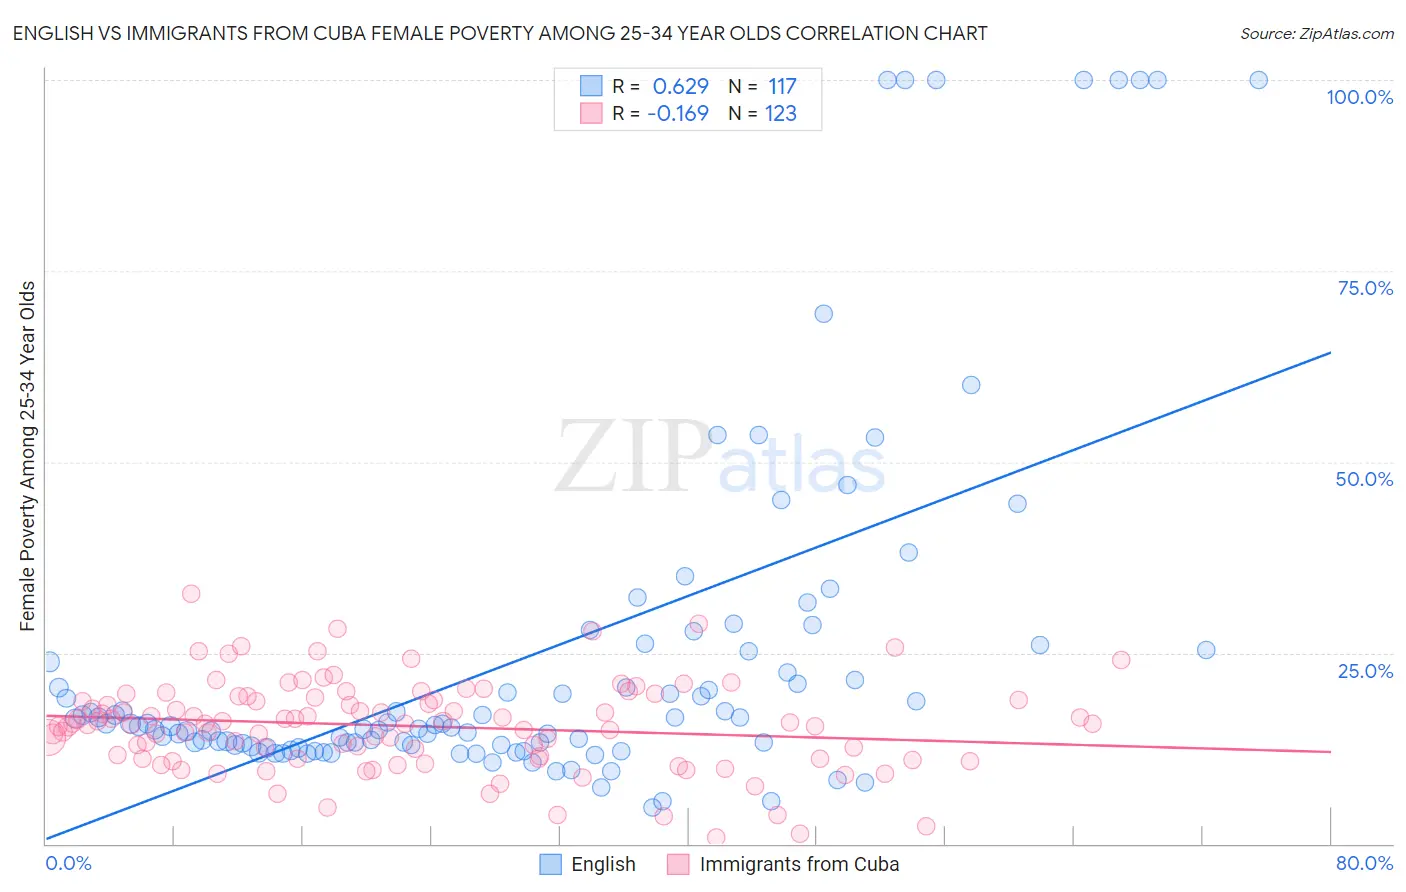
English vs Immigrants from Cuba Female Poverty Among 25-34 Year Olds Correlation Chart
The statistical analysis conducted on geographies consisting of 554,696,556 people shows a significant positive correlation between the proportion of English and poverty level among females between the ages 25 and 34 in the United States with a correlation coefficient (R) of 0.629 and weighted average of 13.9%. Similarly, the statistical analysis conducted on geographies consisting of 321,983,210 people shows a poor negative correlation between the proportion of Immigrants from Cuba and poverty level among females between the ages 25 and 34 in the United States with a correlation coefficient (R) of -0.169 and weighted average of 15.2%, a difference of 9.4%.
Female Poverty Among 25-34 Year Olds Correlation Summary
| Measurement | English | Immigrants from Cuba |
| Minimum | 4.7% | 0.81% |
| Maximum | 100.0% | 32.8% |
| Range | 95.3% | 32.0% |
| Mean | 24.6% | 15.4% |
| Median | 15.6% | 15.7% |
| Interquartile 25% (IQ1) | 12.9% | 11.1% |
| Interquartile 75% (IQ3) | 24.5% | 19.1% |
| Interquartile Range (IQR) | 11.6% | 8.0% |
| Standard Deviation (Sample) | 23.4% | 5.9% |
| Standard Deviation (Population) | 23.3% | 5.8% |
Similar Demographics by Female Poverty Among 25-34 Year Olds
Demographics Similar to English by Female Poverty Among 25-34 Year Olds
In terms of female poverty among 25-34 year olds, the demographic groups most similar to English are Hmong (13.9%, a difference of 0.020%), Immigrants from Germany (13.9%, a difference of 0.060%), Immigrants from Saudi Arabia (13.9%, a difference of 0.18%), Immigrants from Trinidad and Tobago (14.0%, a difference of 0.37%), and Scottish (13.9%, a difference of 0.38%).
| Demographics | Rating | Rank | Female Poverty Among 25-34 Year Olds |
| Tlingit-Haida | 28.1 /100 | #192 | Fair 13.8% |
| Immigrants | Kenya | 28.0 /100 | #193 | Fair 13.8% |
| Moroccans | 25.1 /100 | #194 | Fair 13.8% |
| Immigrants | Cambodia | 24.0 /100 | #195 | Fair 13.9% |
| Scottish | 23.6 /100 | #196 | Fair 13.9% |
| Immigrants | Saudi Arabia | 21.9 /100 | #197 | Fair 13.9% |
| Immigrants | Germany | 20.9 /100 | #198 | Fair 13.9% |
| English | 20.4 /100 | #199 | Fair 13.9% |
| Hmong | 20.3 /100 | #200 | Fair 13.9% |
| Immigrants | Trinidad and Tobago | 17.6 /100 | #201 | Poor 14.0% |
| Welsh | 17.2 /100 | #202 | Poor 14.0% |
| Immigrants | Immigrants | 14.5 /100 | #203 | Poor 14.0% |
| Hawaiians | 13.6 /100 | #204 | Poor 14.1% |
| Immigrants | Africa | 13.4 /100 | #205 | Poor 14.1% |
| Hungarians | 11.8 /100 | #206 | Poor 14.1% |
Demographics Similar to Immigrants from Cuba by Female Poverty Among 25-34 Year Olds
In terms of female poverty among 25-34 year olds, the demographic groups most similar to Immigrants from Cuba are Nepalese (15.2%, a difference of 0.020%), Immigrants from Burma/Myanmar (15.2%, a difference of 0.28%), West Indian (15.2%, a difference of 0.30%), Marshallese (15.3%, a difference of 0.37%), and Immigrants from Laos (15.2%, a difference of 0.47%).
| Demographics | Rating | Rank | Female Poverty Among 25-34 Year Olds |
| Belizeans | 0.4 /100 | #252 | Tragic 15.1% |
| Immigrants | West Indies | 0.4 /100 | #253 | Tragic 15.1% |
| Somalis | 0.4 /100 | #254 | Tragic 15.1% |
| Immigrants | Laos | 0.3 /100 | #255 | Tragic 15.2% |
| West Indians | 0.3 /100 | #256 | Tragic 15.2% |
| Immigrants | Burma/Myanmar | 0.3 /100 | #257 | Tragic 15.2% |
| Nepalese | 0.2 /100 | #258 | Tragic 15.2% |
| Immigrants | Cuba | 0.2 /100 | #259 | Tragic 15.2% |
| Marshallese | 0.2 /100 | #260 | Tragic 15.3% |
| Liberians | 0.2 /100 | #261 | Tragic 15.3% |
| Immigrants | Belize | 0.2 /100 | #262 | Tragic 15.3% |
| Mexican American Indians | 0.2 /100 | #263 | Tragic 15.4% |
| Pennsylvania Germans | 0.1 /100 | #264 | Tragic 15.4% |
| Immigrants | Liberia | 0.1 /100 | #265 | Tragic 15.4% |
| Immigrants | Somalia | 0.1 /100 | #266 | Tragic 15.4% |