Immigrants from Latvia vs Cherokee Female Poverty Among 25-34 Year Olds
COMPARE
Immigrants from Latvia
Cherokee
Female Poverty Among 25-34 Year Olds
Female Poverty Among 25-34 Year Olds Comparison
Immigrants from Latvia
Cherokee
12.5%
FEMALE POVERTY AMONG 25-34 YEAR OLDS
97.7/ 100
METRIC RATING
84th/ 347
METRIC RANK
17.2%
FEMALE POVERTY AMONG 25-34 YEAR OLDS
0.0/ 100
METRIC RATING
310th/ 347
METRIC RANK
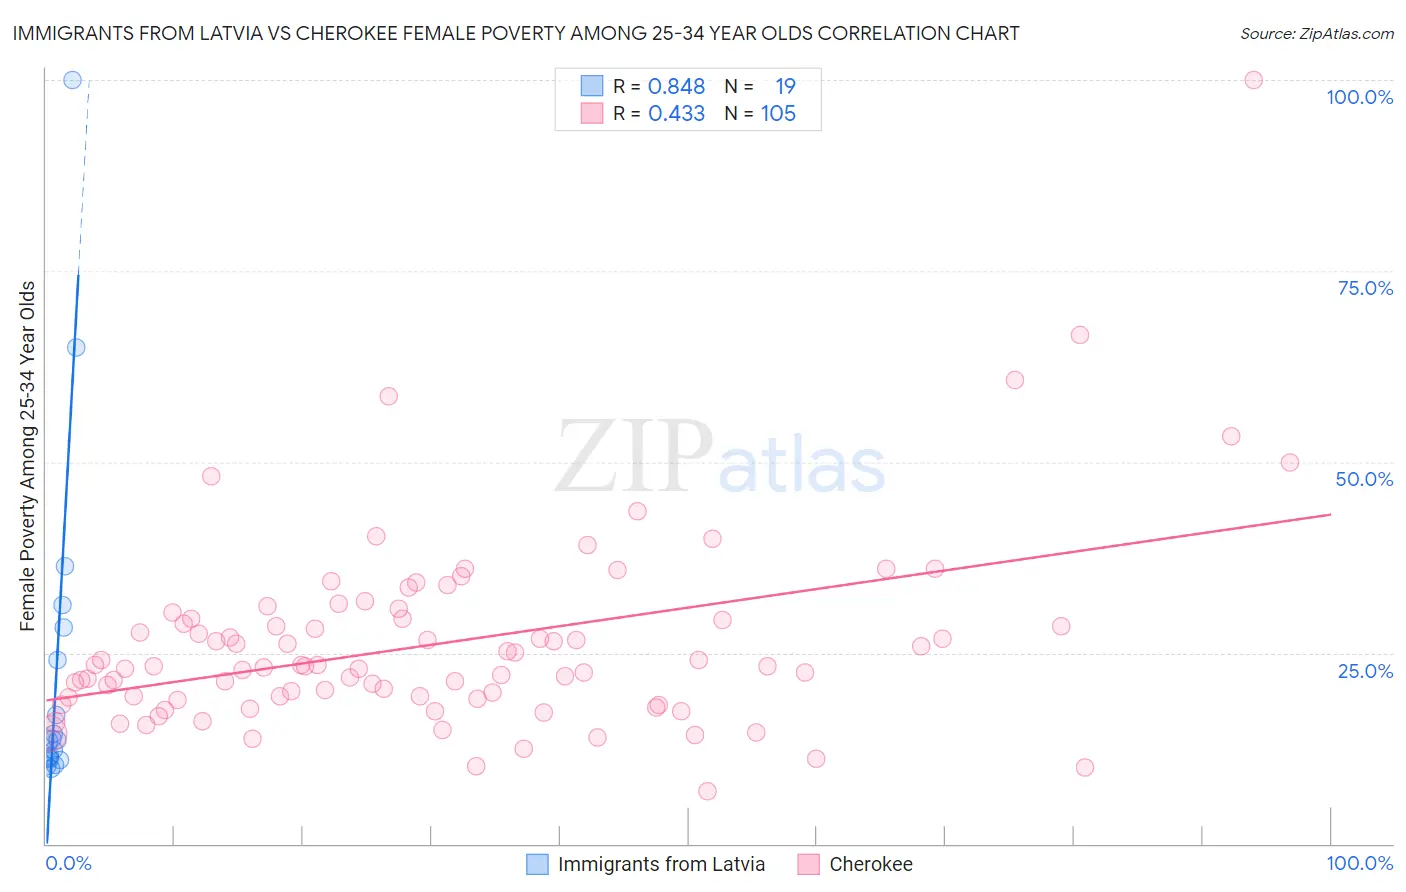
Immigrants from Latvia vs Cherokee Female Poverty Among 25-34 Year Olds Correlation Chart
The statistical analysis conducted on geographies consisting of 113,031,058 people shows a very strong positive correlation between the proportion of Immigrants from Latvia and poverty level among females between the ages 25 and 34 in the United States with a correlation coefficient (R) of 0.848 and weighted average of 12.5%. Similarly, the statistical analysis conducted on geographies consisting of 483,649,449 people shows a moderate positive correlation between the proportion of Cherokee and poverty level among females between the ages 25 and 34 in the United States with a correlation coefficient (R) of 0.433 and weighted average of 17.2%, a difference of 37.7%.
Female Poverty Among 25-34 Year Olds Correlation Summary
| Measurement | Immigrants from Latvia | Cherokee |
| Minimum | 9.8% | 6.9% |
| Maximum | 100.0% | 100.0% |
| Range | 90.2% | 93.1% |
| Mean | 23.4% | 26.3% |
| Median | 13.6% | 23.3% |
| Interquartile 25% (IQ1) | 11.1% | 19.1% |
| Interquartile 75% (IQ3) | 28.4% | 29.5% |
| Interquartile Range (IQR) | 17.3% | 10.4% |
| Standard Deviation (Sample) | 23.0% | 12.8% |
| Standard Deviation (Population) | 22.4% | 12.7% |
Similar Demographics by Female Poverty Among 25-34 Year Olds
Demographics Similar to Immigrants from Latvia by Female Poverty Among 25-34 Year Olds
In terms of female poverty among 25-34 year olds, the demographic groups most similar to Immigrants from Latvia are Albanian (12.5%, a difference of 0.060%), Immigrants from South Eastern Asia (12.5%, a difference of 0.11%), Croatian (12.5%, a difference of 0.13%), Argentinean (12.5%, a difference of 0.15%), and Immigrants from Austria (12.5%, a difference of 0.23%).
| Demographics | Rating | Rank | Female Poverty Among 25-34 Year Olds |
| Immigrants | Italy | 98.8 /100 | #77 | Exceptional 12.3% |
| Immigrants | Ukraine | 98.6 /100 | #78 | Exceptional 12.3% |
| Immigrants | Jordan | 98.5 /100 | #79 | Exceptional 12.4% |
| Immigrants | Malaysia | 98.3 /100 | #80 | Exceptional 12.4% |
| Immigrants | Kazakhstan | 98.1 /100 | #81 | Exceptional 12.4% |
| Ethiopians | 98.0 /100 | #82 | Exceptional 12.4% |
| Albanians | 97.7 /100 | #83 | Exceptional 12.5% |
| Immigrants | Latvia | 97.7 /100 | #84 | Exceptional 12.5% |
| Immigrants | South Eastern Asia | 97.6 /100 | #85 | Exceptional 12.5% |
| Croatians | 97.5 /100 | #86 | Exceptional 12.5% |
| Argentineans | 97.5 /100 | #87 | Exceptional 12.5% |
| Immigrants | Austria | 97.4 /100 | #88 | Exceptional 12.5% |
| Italians | 97.2 /100 | #89 | Exceptional 12.5% |
| Immigrants | Albania | 97.1 /100 | #90 | Exceptional 12.5% |
| Norwegians | 96.9 /100 | #91 | Exceptional 12.6% |
Demographics Similar to Cherokee by Female Poverty Among 25-34 Year Olds
In terms of female poverty among 25-34 year olds, the demographic groups most similar to Cherokee are Ottawa (17.1%, a difference of 0.47%), Immigrants from Honduras (17.3%, a difference of 0.48%), African (17.0%, a difference of 0.77%), Yaqui (17.0%, a difference of 0.98%), and Chickasaw (17.0%, a difference of 0.99%).
| Demographics | Rating | Rank | Female Poverty Among 25-34 Year Olds |
| Immigrants | Mexico | 0.0 /100 | #303 | Tragic 16.8% |
| Hondurans | 0.0 /100 | #304 | Tragic 16.9% |
| Immigrants | Cabo Verde | 0.0 /100 | #305 | Tragic 16.9% |
| Chickasaw | 0.0 /100 | #306 | Tragic 17.0% |
| Yaqui | 0.0 /100 | #307 | Tragic 17.0% |
| Africans | 0.0 /100 | #308 | Tragic 17.0% |
| Ottawa | 0.0 /100 | #309 | Tragic 17.1% |
| Cherokee | 0.0 /100 | #310 | Tragic 17.2% |
| Immigrants | Honduras | 0.0 /100 | #311 | Tragic 17.3% |
| Iroquois | 0.0 /100 | #312 | Tragic 17.5% |
| Colville | 0.0 /100 | #313 | Tragic 17.5% |
| Immigrants | Dominican Republic | 0.0 /100 | #314 | Tragic 17.6% |
| Yakama | 0.0 /100 | #315 | Tragic 17.6% |
| Dominicans | 0.0 /100 | #316 | Tragic 17.6% |
| Arapaho | 0.0 /100 | #317 | Tragic 17.8% |