Menominee vs Immigrants from Sri Lanka Family Poverty
COMPARE
Menominee
Immigrants from Sri Lanka
Family Poverty
Family Poverty Comparison
Menominee
Immigrants from Sri Lanka
12.7%
FAMILY POVERTY
0.0/ 100
METRIC RATING
323rd/ 347
METRIC RANK
7.7%
FAMILY POVERTY
98.9/ 100
METRIC RATING
48th/ 347
METRIC RANK
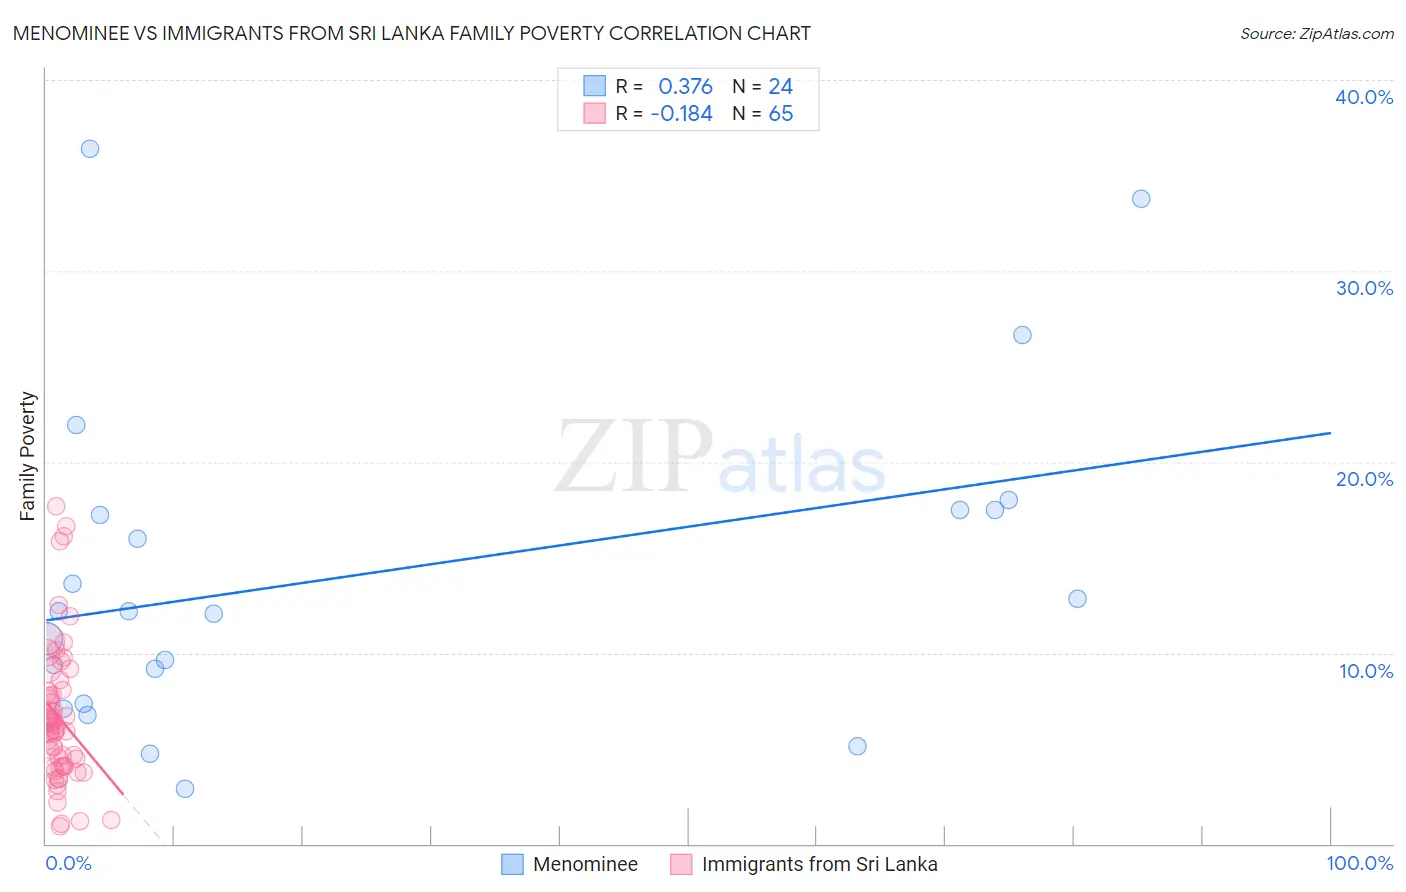
Menominee vs Immigrants from Sri Lanka Family Poverty Correlation Chart
The statistical analysis conducted on geographies consisting of 45,766,702 people shows a mild positive correlation between the proportion of Menominee and poverty level among families in the United States with a correlation coefficient (R) of 0.376 and weighted average of 12.7%. Similarly, the statistical analysis conducted on geographies consisting of 149,580,330 people shows a poor negative correlation between the proportion of Immigrants from Sri Lanka and poverty level among families in the United States with a correlation coefficient (R) of -0.184 and weighted average of 7.7%, a difference of 66.0%.
Family Poverty Correlation Summary
| Measurement | Menominee | Immigrants from Sri Lanka |
| Minimum | 2.9% | 0.89% |
| Maximum | 36.4% | 17.7% |
| Range | 33.5% | 16.8% |
| Mean | 14.2% | 6.6% |
| Median | 12.2% | 6.1% |
| Interquartile 25% (IQ1) | 8.2% | 4.1% |
| Interquartile 75% (IQ3) | 17.5% | 8.0% |
| Interquartile Range (IQR) | 9.3% | 3.9% |
| Standard Deviation (Sample) | 8.6% | 3.6% |
| Standard Deviation (Population) | 8.4% | 3.6% |
Similar Demographics by Family Poverty
Demographics Similar to Menominee by Family Poverty
In terms of family poverty, the demographic groups most similar to Menominee are Immigrants from Dominica (12.7%, a difference of 0.080%), Immigrants from Honduras (12.7%, a difference of 0.54%), Arapaho (12.7%, a difference of 0.65%), Paiute (13.0%, a difference of 2.0%), and Colville (13.0%, a difference of 2.1%).
| Demographics | Rating | Rank | Family Poverty |
| Hondurans | 0.0 /100 | #316 | Tragic 12.4% |
| Immigrants | Grenada | 0.0 /100 | #317 | Tragic 12.4% |
| U.S. Virgin Islanders | 0.0 /100 | #318 | Tragic 12.4% |
| British West Indians | 0.0 /100 | #319 | Tragic 12.4% |
| Inupiat | 0.0 /100 | #320 | Tragic 12.5% |
| Arapaho | 0.0 /100 | #321 | Tragic 12.7% |
| Immigrants | Honduras | 0.0 /100 | #322 | Tragic 12.7% |
| Menominee | 0.0 /100 | #323 | Tragic 12.7% |
| Immigrants | Dominica | 0.0 /100 | #324 | Tragic 12.7% |
| Paiute | 0.0 /100 | #325 | Tragic 13.0% |
| Colville | 0.0 /100 | #326 | Tragic 13.0% |
| Yakama | 0.0 /100 | #327 | Tragic 13.1% |
| Central American Indians | 0.0 /100 | #328 | Tragic 13.3% |
| Blacks/African Americans | 0.0 /100 | #329 | Tragic 13.3% |
| Natives/Alaskans | 0.0 /100 | #330 | Tragic 14.3% |
Demographics Similar to Immigrants from Sri Lanka by Family Poverty
In terms of family poverty, the demographic groups most similar to Immigrants from Sri Lanka are Immigrants from Czechoslovakia (7.7%, a difference of 0.020%), Tongan (7.7%, a difference of 0.030%), Okinawan (7.7%, a difference of 0.040%), German (7.7%, a difference of 0.17%), and Immigrants from Bolivia (7.7%, a difference of 0.19%).
| Demographics | Rating | Rank | Family Poverty |
| Immigrants | Australia | 99.2 /100 | #41 | Exceptional 7.6% |
| Scandinavians | 99.1 /100 | #42 | Exceptional 7.6% |
| Immigrants | Austria | 99.1 /100 | #43 | Exceptional 7.6% |
| Germans | 99.0 /100 | #44 | Exceptional 7.7% |
| Okinawans | 98.9 /100 | #45 | Exceptional 7.7% |
| Tongans | 98.9 /100 | #46 | Exceptional 7.7% |
| Immigrants | Czechoslovakia | 98.9 /100 | #47 | Exceptional 7.7% |
| Immigrants | Sri Lanka | 98.9 /100 | #48 | Exceptional 7.7% |
| Immigrants | Bolivia | 98.9 /100 | #49 | Exceptional 7.7% |
| Immigrants | North Macedonia | 98.9 /100 | #50 | Exceptional 7.7% |
| Immigrants | Moldova | 98.8 /100 | #51 | Exceptional 7.7% |
| Indians (Asian) | 98.8 /100 | #52 | Exceptional 7.7% |
| Swiss | 98.8 /100 | #53 | Exceptional 7.7% |
| Immigrants | Sweden | 98.8 /100 | #54 | Exceptional 7.7% |
| Immigrants | Eastern Asia | 98.7 /100 | #55 | Exceptional 7.7% |