Menominee vs Thai Family Poverty
COMPARE
Menominee
Thai
Family Poverty
Family Poverty Comparison
Menominee
Thais
12.7%
FAMILY POVERTY
0.0/ 100
METRIC RATING
323rd/ 347
METRIC RANK
6.7%
FAMILY POVERTY
100.0/ 100
METRIC RATING
5th/ 347
METRIC RANK
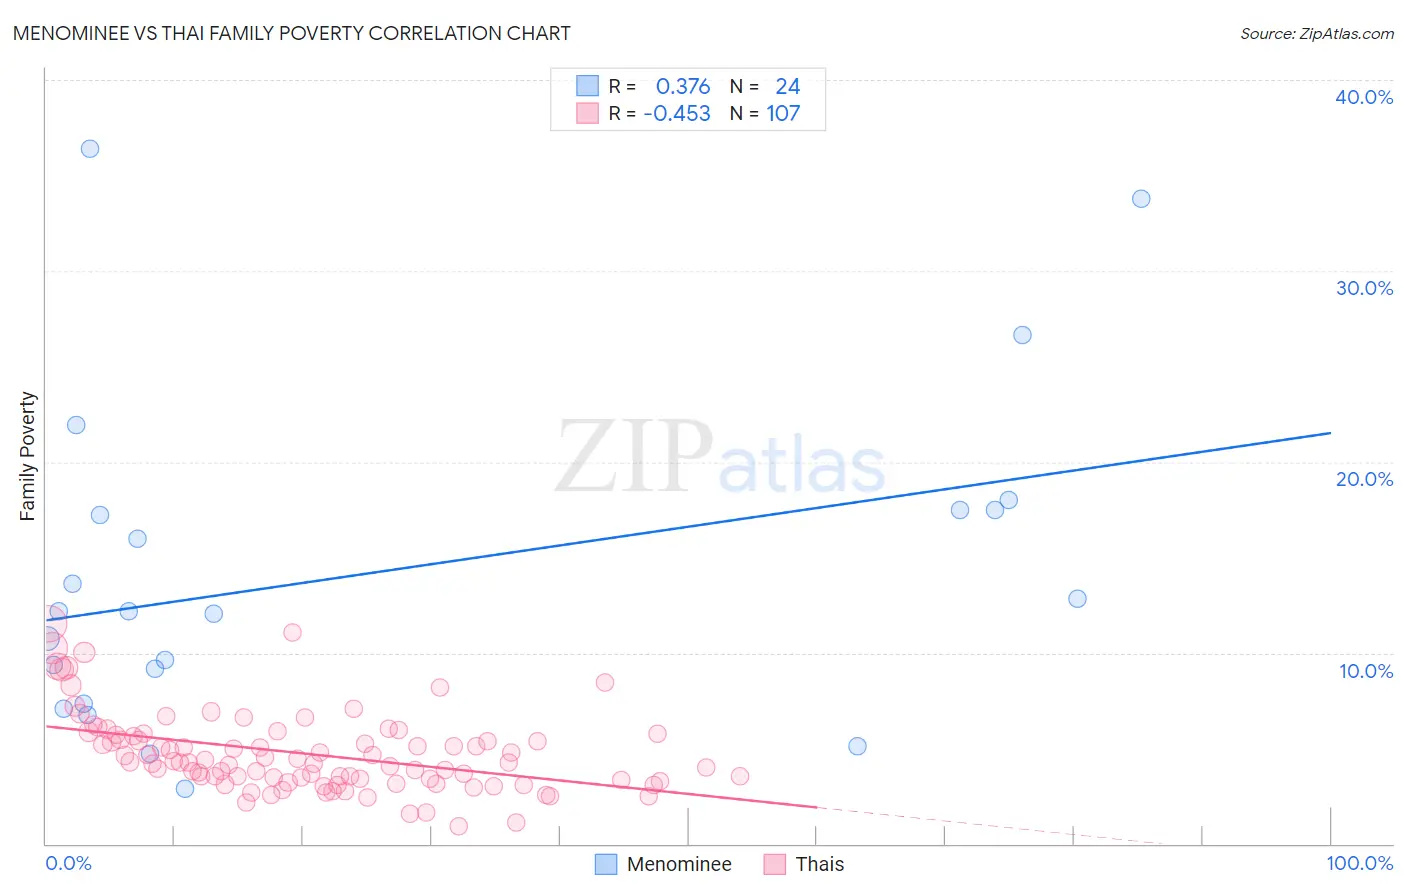
Menominee vs Thai Family Poverty Correlation Chart
The statistical analysis conducted on geographies consisting of 45,766,702 people shows a mild positive correlation between the proportion of Menominee and poverty level among families in the United States with a correlation coefficient (R) of 0.376 and weighted average of 12.7%. Similarly, the statistical analysis conducted on geographies consisting of 473,767,426 people shows a moderate negative correlation between the proportion of Thais and poverty level among families in the United States with a correlation coefficient (R) of -0.453 and weighted average of 6.7%, a difference of 90.4%.
Family Poverty Correlation Summary
| Measurement | Menominee | Thai |
| Minimum | 2.9% | 0.91% |
| Maximum | 36.4% | 11.5% |
| Range | 33.5% | 10.6% |
| Mean | 14.2% | 4.7% |
| Median | 12.2% | 4.3% |
| Interquartile 25% (IQ1) | 8.2% | 3.3% |
| Interquartile 75% (IQ3) | 17.5% | 5.7% |
| Interquartile Range (IQR) | 9.3% | 2.4% |
| Standard Deviation (Sample) | 8.6% | 2.1% |
| Standard Deviation (Population) | 8.4% | 2.1% |
Similar Demographics by Family Poverty
Demographics Similar to Menominee by Family Poverty
In terms of family poverty, the demographic groups most similar to Menominee are Immigrants from Dominica (12.7%, a difference of 0.080%), Immigrants from Honduras (12.7%, a difference of 0.54%), Arapaho (12.7%, a difference of 0.65%), Paiute (13.0%, a difference of 2.0%), and Colville (13.0%, a difference of 2.1%).
| Demographics | Rating | Rank | Family Poverty |
| Hondurans | 0.0 /100 | #316 | Tragic 12.4% |
| Immigrants | Grenada | 0.0 /100 | #317 | Tragic 12.4% |
| U.S. Virgin Islanders | 0.0 /100 | #318 | Tragic 12.4% |
| British West Indians | 0.0 /100 | #319 | Tragic 12.4% |
| Inupiat | 0.0 /100 | #320 | Tragic 12.5% |
| Arapaho | 0.0 /100 | #321 | Tragic 12.7% |
| Immigrants | Honduras | 0.0 /100 | #322 | Tragic 12.7% |
| Menominee | 0.0 /100 | #323 | Tragic 12.7% |
| Immigrants | Dominica | 0.0 /100 | #324 | Tragic 12.7% |
| Paiute | 0.0 /100 | #325 | Tragic 13.0% |
| Colville | 0.0 /100 | #326 | Tragic 13.0% |
| Yakama | 0.0 /100 | #327 | Tragic 13.1% |
| Central American Indians | 0.0 /100 | #328 | Tragic 13.3% |
| Blacks/African Americans | 0.0 /100 | #329 | Tragic 13.3% |
| Natives/Alaskans | 0.0 /100 | #330 | Tragic 14.3% |
Demographics Similar to Thais by Family Poverty
In terms of family poverty, the demographic groups most similar to Thais are Filipino (6.6%, a difference of 0.57%), Immigrants from Taiwan (6.6%, a difference of 1.2%), Chinese (6.5%, a difference of 2.8%), Norwegian (6.9%, a difference of 3.0%), and Immigrants from Ireland (7.0%, a difference of 4.4%).
| Demographics | Rating | Rank | Family Poverty |
| Immigrants | India | 100.0 /100 | #1 | Exceptional 6.2% |
| Chinese | 100.0 /100 | #2 | Exceptional 6.5% |
| Immigrants | Taiwan | 100.0 /100 | #3 | Exceptional 6.6% |
| Filipinos | 100.0 /100 | #4 | Exceptional 6.6% |
| Thais | 100.0 /100 | #5 | Exceptional 6.7% |
| Norwegians | 99.9 /100 | #6 | Exceptional 6.9% |
| Immigrants | Ireland | 99.9 /100 | #7 | Exceptional 7.0% |
| Bhutanese | 99.9 /100 | #8 | Exceptional 7.0% |
| Latvians | 99.9 /100 | #9 | Exceptional 7.1% |
| Bulgarians | 99.8 /100 | #10 | Exceptional 7.1% |
| Immigrants | Singapore | 99.8 /100 | #11 | Exceptional 7.1% |
| Maltese | 99.8 /100 | #12 | Exceptional 7.1% |
| Swedes | 99.8 /100 | #13 | Exceptional 7.1% |
| Iranians | 99.8 /100 | #14 | Exceptional 7.1% |
| Lithuanians | 99.8 /100 | #15 | Exceptional 7.2% |