Menominee vs Immigrants from Indonesia Family Poverty
COMPARE
Menominee
Immigrants from Indonesia
Family Poverty
Family Poverty Comparison
Menominee
Immigrants from Indonesia
12.7%
FAMILY POVERTY
0.0/ 100
METRIC RATING
323rd/ 347
METRIC RANK
8.1%
FAMILY POVERTY
95.7/ 100
METRIC RATING
102nd/ 347
METRIC RANK
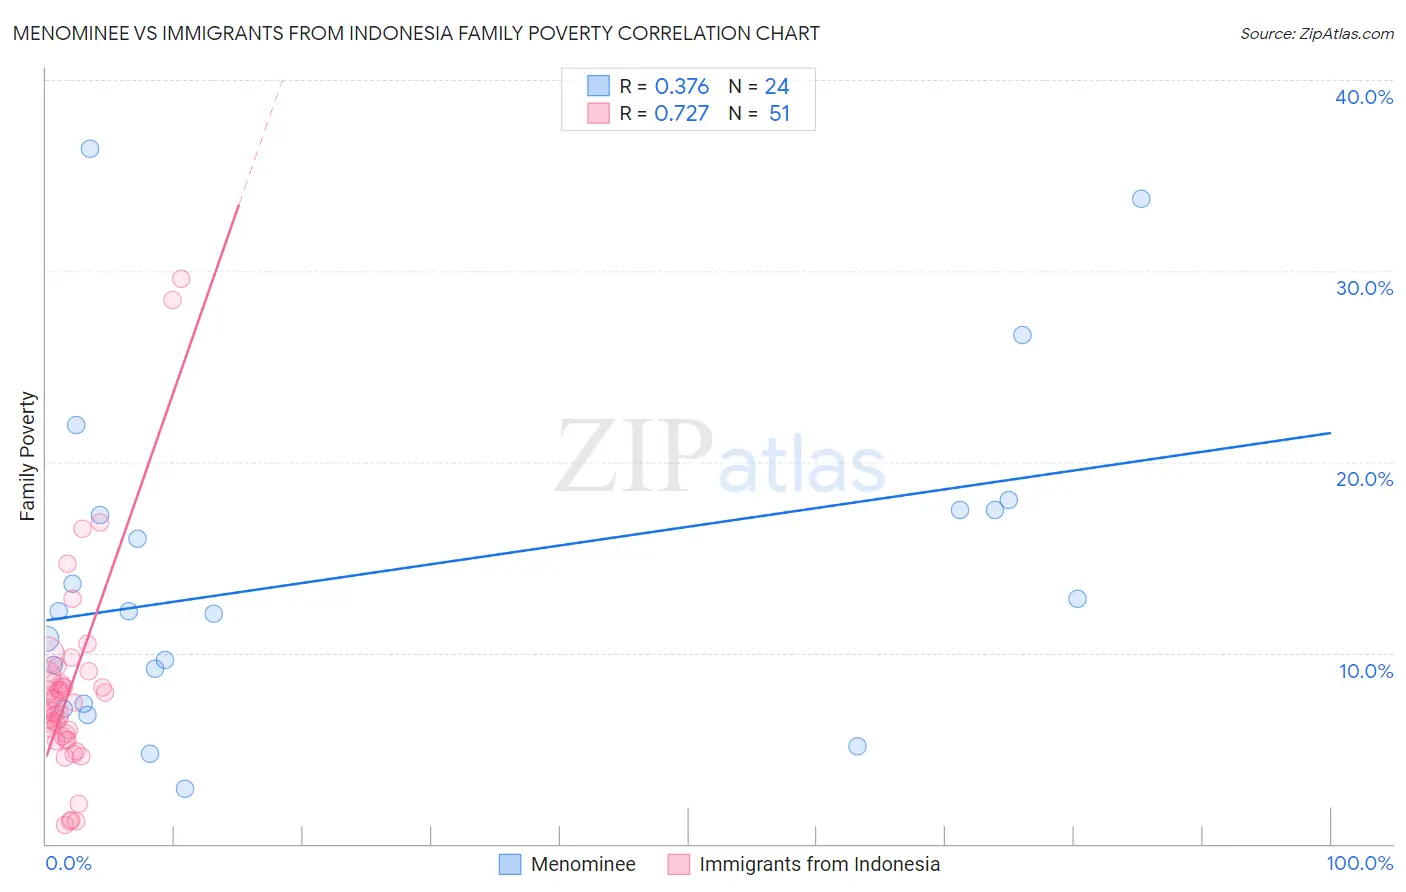
Menominee vs Immigrants from Indonesia Family Poverty Correlation Chart
The statistical analysis conducted on geographies consisting of 45,766,702 people shows a mild positive correlation between the proportion of Menominee and poverty level among families in the United States with a correlation coefficient (R) of 0.376 and weighted average of 12.7%. Similarly, the statistical analysis conducted on geographies consisting of 215,549,629 people shows a strong positive correlation between the proportion of Immigrants from Indonesia and poverty level among families in the United States with a correlation coefficient (R) of 0.727 and weighted average of 8.1%, a difference of 57.4%.
Family Poverty Correlation Summary
| Measurement | Menominee | Immigrants from Indonesia |
| Minimum | 2.9% | 0.98% |
| Maximum | 36.4% | 29.6% |
| Range | 33.5% | 28.6% |
| Mean | 14.2% | 8.1% |
| Median | 12.2% | 7.4% |
| Interquartile 25% (IQ1) | 8.2% | 5.6% |
| Interquartile 75% (IQ3) | 17.5% | 8.4% |
| Interquartile Range (IQR) | 9.3% | 2.8% |
| Standard Deviation (Sample) | 8.6% | 5.4% |
| Standard Deviation (Population) | 8.4% | 5.3% |
Similar Demographics by Family Poverty
Demographics Similar to Menominee by Family Poverty
In terms of family poverty, the demographic groups most similar to Menominee are Immigrants from Dominica (12.7%, a difference of 0.080%), Immigrants from Honduras (12.7%, a difference of 0.54%), Arapaho (12.7%, a difference of 0.65%), Paiute (13.0%, a difference of 2.0%), and Colville (13.0%, a difference of 2.1%).
| Demographics | Rating | Rank | Family Poverty |
| Hondurans | 0.0 /100 | #316 | Tragic 12.4% |
| Immigrants | Grenada | 0.0 /100 | #317 | Tragic 12.4% |
| U.S. Virgin Islanders | 0.0 /100 | #318 | Tragic 12.4% |
| British West Indians | 0.0 /100 | #319 | Tragic 12.4% |
| Inupiat | 0.0 /100 | #320 | Tragic 12.5% |
| Arapaho | 0.0 /100 | #321 | Tragic 12.7% |
| Immigrants | Honduras | 0.0 /100 | #322 | Tragic 12.7% |
| Menominee | 0.0 /100 | #323 | Tragic 12.7% |
| Immigrants | Dominica | 0.0 /100 | #324 | Tragic 12.7% |
| Paiute | 0.0 /100 | #325 | Tragic 13.0% |
| Colville | 0.0 /100 | #326 | Tragic 13.0% |
| Yakama | 0.0 /100 | #327 | Tragic 13.1% |
| Central American Indians | 0.0 /100 | #328 | Tragic 13.3% |
| Blacks/African Americans | 0.0 /100 | #329 | Tragic 13.3% |
| Natives/Alaskans | 0.0 /100 | #330 | Tragic 14.3% |
Demographics Similar to Immigrants from Indonesia by Family Poverty
In terms of family poverty, the demographic groups most similar to Immigrants from Indonesia are Immigrants from Norway (8.1%, a difference of 0.010%), New Zealander (8.1%, a difference of 0.040%), Immigrants from Eastern Europe (8.1%, a difference of 0.090%), Slavic (8.1%, a difference of 0.10%), and Welsh (8.1%, a difference of 0.11%).
| Demographics | Rating | Rank | Family Poverty |
| Immigrants | Philippines | 96.5 /100 | #95 | Exceptional 8.0% |
| Immigrants | Turkey | 96.5 /100 | #96 | Exceptional 8.0% |
| Immigrants | Switzerland | 96.1 /100 | #97 | Exceptional 8.1% |
| Immigrants | South Africa | 95.9 /100 | #98 | Exceptional 8.1% |
| Welsh | 95.8 /100 | #99 | Exceptional 8.1% |
| New Zealanders | 95.8 /100 | #100 | Exceptional 8.1% |
| Immigrants | Norway | 95.7 /100 | #101 | Exceptional 8.1% |
| Immigrants | Indonesia | 95.7 /100 | #102 | Exceptional 8.1% |
| Immigrants | Eastern Europe | 95.6 /100 | #103 | Exceptional 8.1% |
| Slavs | 95.6 /100 | #104 | Exceptional 8.1% |
| Laotians | 95.6 /100 | #105 | Exceptional 8.1% |
| Egyptians | 95.1 /100 | #106 | Exceptional 8.1% |
| French Canadians | 95.0 /100 | #107 | Exceptional 8.1% |
| Basques | 94.9 /100 | #108 | Exceptional 8.1% |
| Jordanians | 94.8 /100 | #109 | Exceptional 8.2% |