Luxembourger vs Ute Poverty
COMPARE
Luxembourger
Ute
Poverty
Poverty Comparison
Luxembourgers
Ute
10.6%
POVERTY
99.7/ 100
METRIC RATING
21st/ 347
METRIC RANK
16.9%
POVERTY
0.0/ 100
METRIC RATING
328th/ 347
METRIC RANK
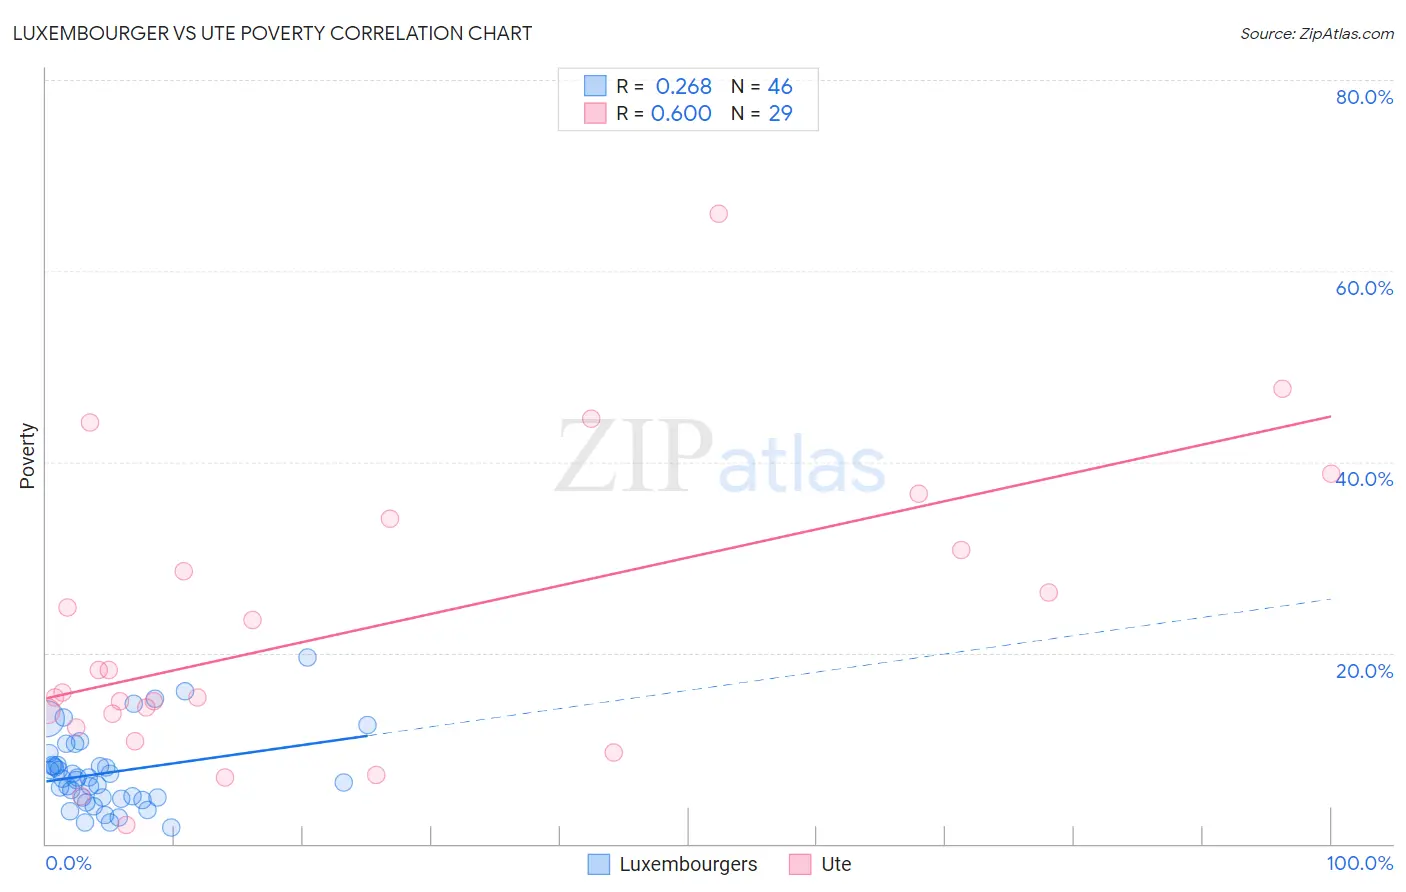
Luxembourger vs Ute Poverty Correlation Chart
The statistical analysis conducted on geographies consisting of 144,648,044 people shows a weak positive correlation between the proportion of Luxembourgers and poverty level in the United States with a correlation coefficient (R) of 0.268 and weighted average of 10.6%. Similarly, the statistical analysis conducted on geographies consisting of 55,667,697 people shows a significant positive correlation between the proportion of Ute and poverty level in the United States with a correlation coefficient (R) of 0.600 and weighted average of 16.9%, a difference of 59.8%.
Poverty Correlation Summary
| Measurement | Luxembourger | Ute |
| Minimum | 1.6% | 2.0% |
| Maximum | 19.5% | 66.0% |
| Range | 17.9% | 64.0% |
| Mean | 7.5% | 22.6% |
| Median | 6.8% | 15.9% |
| Interquartile 25% (IQ1) | 4.8% | 12.9% |
| Interquartile 75% (IQ3) | 8.3% | 32.4% |
| Interquartile Range (IQR) | 3.5% | 19.5% |
| Standard Deviation (Sample) | 3.9% | 15.0% |
| Standard Deviation (Population) | 3.9% | 14.8% |
Similar Demographics by Poverty
Demographics Similar to Luxembourgers by Poverty
In terms of poverty, the demographic groups most similar to Luxembourgers are Immigrants from North Macedonia (10.6%, a difference of 0.080%), Eastern European (10.6%, a difference of 0.16%), Immigrants from Scotland (10.6%, a difference of 0.19%), Swedish (10.6%, a difference of 0.27%), and Italian (10.6%, a difference of 0.31%).
| Demographics | Rating | Rank | Poverty |
| Immigrants | Bolivia | 99.8 /100 | #14 | Exceptional 10.4% |
| Bolivians | 99.8 /100 | #15 | Exceptional 10.4% |
| Lithuanians | 99.8 /100 | #16 | Exceptional 10.5% |
| Norwegians | 99.8 /100 | #17 | Exceptional 10.5% |
| Latvians | 99.8 /100 | #18 | Exceptional 10.5% |
| Immigrants | Scotland | 99.7 /100 | #19 | Exceptional 10.6% |
| Immigrants | North Macedonia | 99.7 /100 | #20 | Exceptional 10.6% |
| Luxembourgers | 99.7 /100 | #21 | Exceptional 10.6% |
| Eastern Europeans | 99.7 /100 | #22 | Exceptional 10.6% |
| Swedes | 99.7 /100 | #23 | Exceptional 10.6% |
| Italians | 99.7 /100 | #24 | Exceptional 10.6% |
| Croatians | 99.6 /100 | #25 | Exceptional 10.6% |
| Burmese | 99.6 /100 | #26 | Exceptional 10.7% |
| Immigrants | Northern Europe | 99.6 /100 | #27 | Exceptional 10.7% |
| Immigrants | Korea | 99.5 /100 | #28 | Exceptional 10.7% |
Demographics Similar to Ute by Poverty
In terms of poverty, the demographic groups most similar to Ute are Kiowa (16.8%, a difference of 0.43%), Paiute (16.7%, a difference of 0.96%), Central American Indian (16.7%, a difference of 1.3%), Yakama (16.7%, a difference of 1.5%), and Colville (16.6%, a difference of 2.0%).
| Demographics | Rating | Rank | Poverty |
| Arapaho | 0.0 /100 | #321 | Tragic 16.3% |
| Menominee | 0.0 /100 | #322 | Tragic 16.4% |
| Colville | 0.0 /100 | #323 | Tragic 16.6% |
| Yakama | 0.0 /100 | #324 | Tragic 16.7% |
| Central American Indians | 0.0 /100 | #325 | Tragic 16.7% |
| Paiute | 0.0 /100 | #326 | Tragic 16.7% |
| Kiowa | 0.0 /100 | #327 | Tragic 16.8% |
| Ute | 0.0 /100 | #328 | Tragic 16.9% |
| Blacks/African Americans | 0.0 /100 | #329 | Tragic 17.3% |
| Dominicans | 0.0 /100 | #330 | Tragic 17.6% |
| Immigrants | Dominican Republic | 0.0 /100 | #331 | Tragic 17.8% |
| Natives/Alaskans | 0.0 /100 | #332 | Tragic 18.1% |
| Houma | 0.0 /100 | #333 | Tragic 18.4% |
| Apache | 0.0 /100 | #334 | Tragic 18.4% |
| Cheyenne | 0.0 /100 | #335 | Tragic 18.9% |