Luxembourger vs Ute Disability Age 18 to 34
COMPARE
Luxembourger
Ute
Disability Age 18 to 34
Disability Age 18 to 34 Comparison
Luxembourgers
Ute
6.9%
DISABILITY AGE 18 TO 34
9.4/ 100
METRIC RATING
212th/ 347
METRIC RANK
7.0%
DISABILITY AGE 18 TO 34
3.8/ 100
METRIC RATING
231st/ 347
METRIC RANK
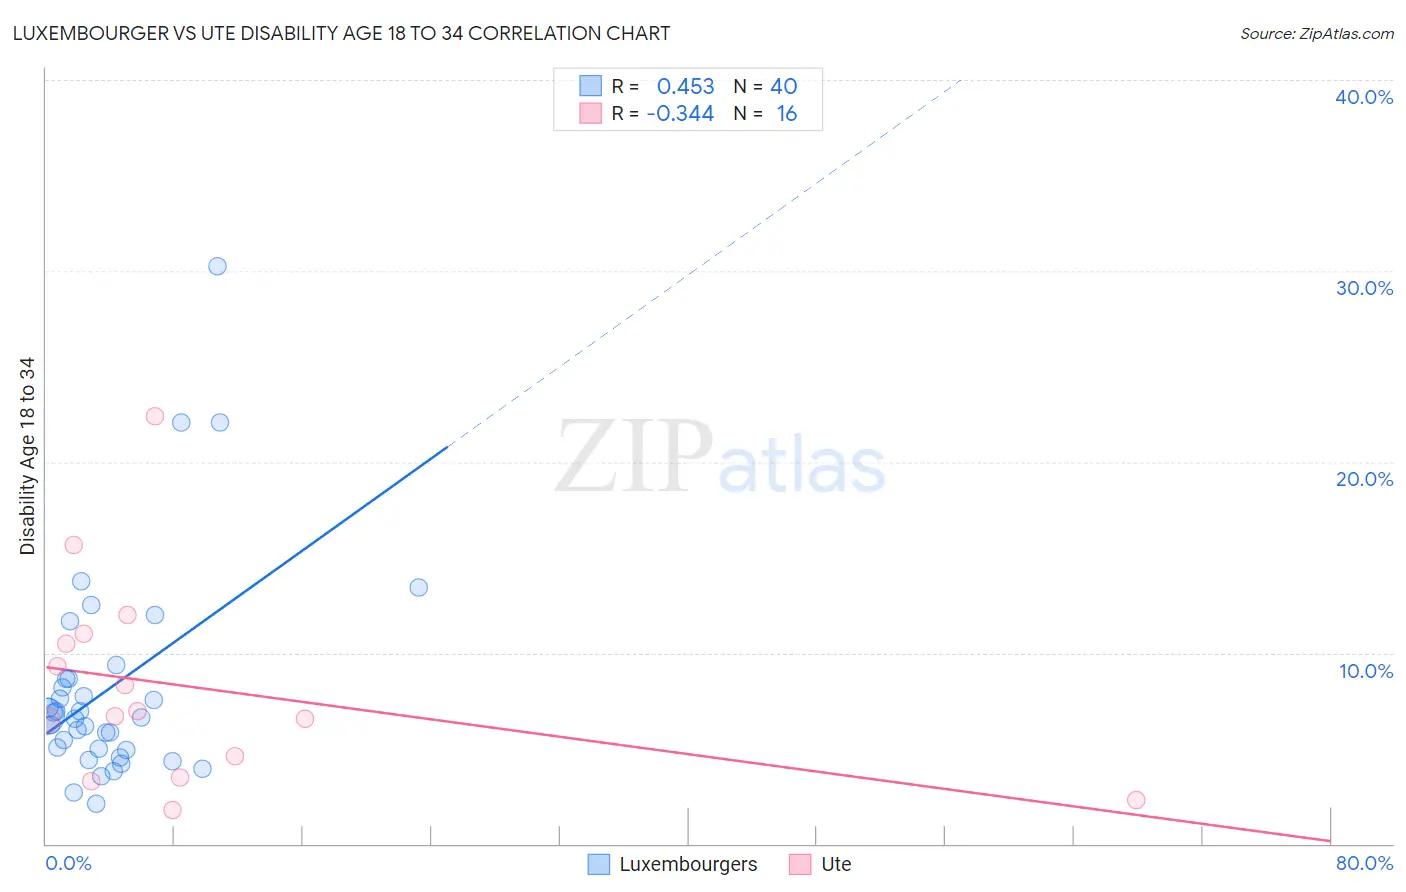
Luxembourger vs Ute Disability Age 18 to 34 Correlation Chart
The statistical analysis conducted on geographies consisting of 144,511,168 people shows a moderate positive correlation between the proportion of Luxembourgers and percentage of population with a disability between the ages 18 and 35 in the United States with a correlation coefficient (R) of 0.453 and weighted average of 6.9%. Similarly, the statistical analysis conducted on geographies consisting of 55,639,467 people shows a mild negative correlation between the proportion of Ute and percentage of population with a disability between the ages 18 and 35 in the United States with a correlation coefficient (R) of -0.344 and weighted average of 7.0%, a difference of 1.6%.
Disability Age 18 to 34 Correlation Summary
| Measurement | Luxembourger | Ute |
| Minimum | 2.1% | 1.7% |
| Maximum | 30.2% | 22.4% |
| Range | 28.1% | 20.7% |
| Mean | 8.2% | 8.2% |
| Median | 6.7% | 6.8% |
| Interquartile 25% (IQ1) | 5.0% | 4.0% |
| Interquartile 75% (IQ3) | 8.6% | 10.7% |
| Interquartile Range (IQR) | 3.7% | 6.7% |
| Standard Deviation (Sample) | 5.6% | 5.4% |
| Standard Deviation (Population) | 5.6% | 5.2% |
Demographics Similar to Luxembourgers and Ute by Disability Age 18 to 34
In terms of disability age 18 to 34, the demographic groups most similar to Luxembourgers are Immigrants from Western Europe (6.9%, a difference of 0.070%), Immigrants from Norway (6.8%, a difference of 0.11%), Serbian (6.9%, a difference of 0.25%), Immigrants from Thailand (6.9%, a difference of 0.40%), and Sudanese (6.9%, a difference of 0.53%). Similarly, the demographic groups most similar to Ute are Immigrants from North America (7.0%, a difference of 0.020%), Lithuanian (7.0%, a difference of 0.11%), Immigrants from Yemen (7.0%, a difference of 0.14%), Immigrants from Canada (7.0%, a difference of 0.20%), and Ugandan (6.9%, a difference of 0.25%).
| Demographics | Rating | Rank | Disability Age 18 to 34 |
| Immigrants | Norway | 10.0 /100 | #211 | Tragic 6.8% |
| Luxembourgers | 9.4 /100 | #212 | Tragic 6.9% |
| Immigrants | Western Europe | 9.1 /100 | #213 | Tragic 6.9% |
| Serbians | 8.2 /100 | #214 | Tragic 6.9% |
| Immigrants | Thailand | 7.5 /100 | #215 | Tragic 6.9% |
| Sudanese | 7.0 /100 | #216 | Tragic 6.9% |
| Immigrants | Kenya | 6.9 /100 | #217 | Tragic 6.9% |
| Ukrainians | 6.7 /100 | #218 | Tragic 6.9% |
| Hawaiians | 6.5 /100 | #219 | Tragic 6.9% |
| Immigrants | Senegal | 5.5 /100 | #220 | Tragic 6.9% |
| Immigrants | Middle Africa | 5.5 /100 | #221 | Tragic 6.9% |
| Immigrants | England | 5.3 /100 | #222 | Tragic 6.9% |
| Carpatho Rusyns | 5.2 /100 | #223 | Tragic 6.9% |
| Senegalese | 4.9 /100 | #224 | Tragic 6.9% |
| Central American Indians | 4.7 /100 | #225 | Tragic 6.9% |
| Ugandans | 4.4 /100 | #226 | Tragic 6.9% |
| Immigrants | Canada | 4.3 /100 | #227 | Tragic 7.0% |
| Immigrants | Yemen | 4.2 /100 | #228 | Tragic 7.0% |
| Lithuanians | 4.1 /100 | #229 | Tragic 7.0% |
| Immigrants | North America | 3.9 /100 | #230 | Tragic 7.0% |
| Ute | 3.8 /100 | #231 | Tragic 7.0% |