Immigrants from Syria vs Ute Poverty
COMPARE
Immigrants from Syria
Ute
Poverty
Poverty Comparison
Immigrants from Syria
Ute
12.3%
POVERTY
47.5/ 100
METRIC RATING
177th/ 347
METRIC RANK
16.9%
POVERTY
0.0/ 100
METRIC RATING
328th/ 347
METRIC RANK
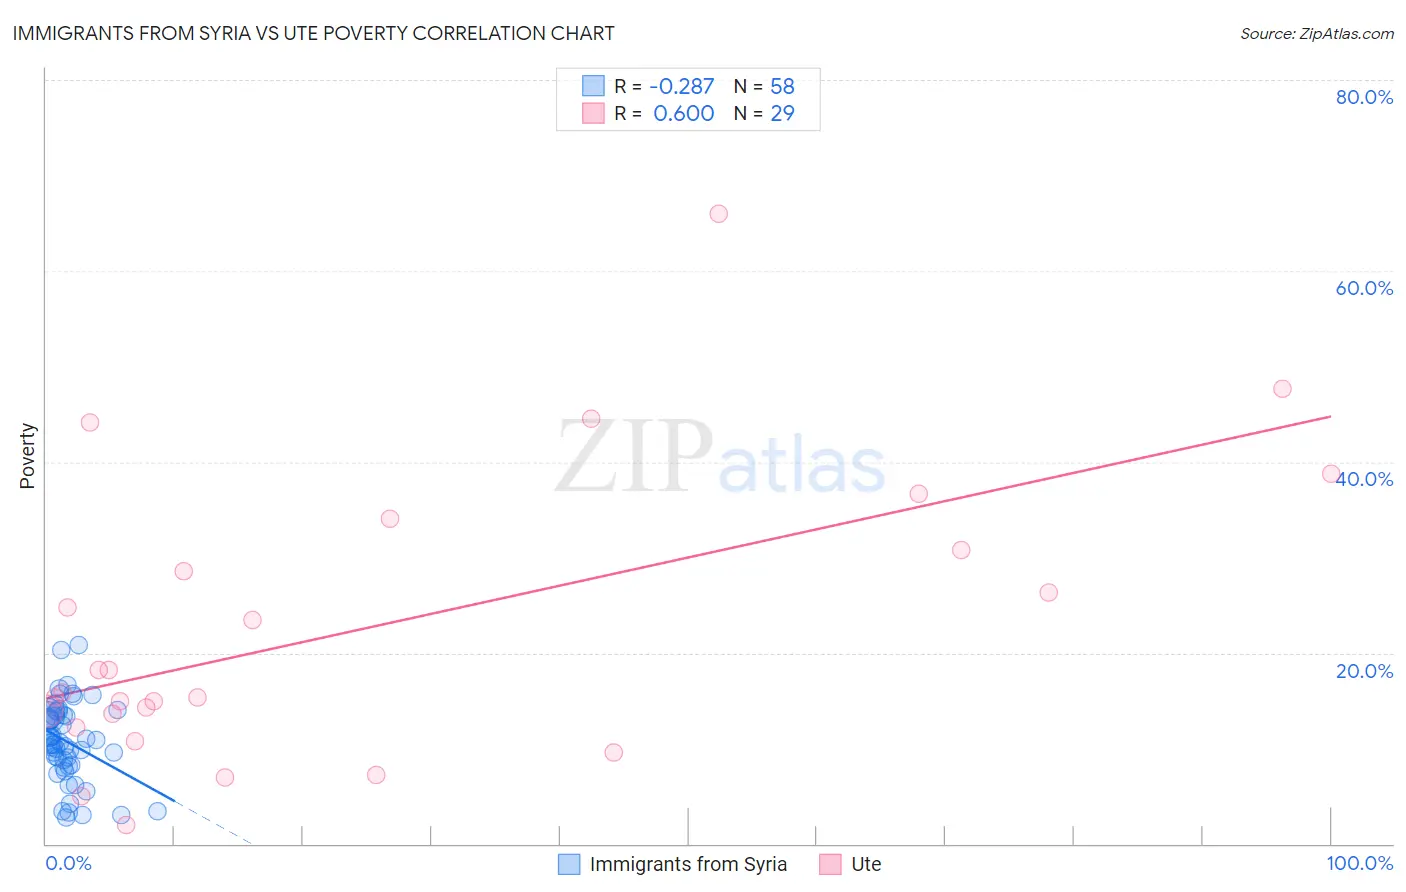
Immigrants from Syria vs Ute Poverty Correlation Chart
The statistical analysis conducted on geographies consisting of 173,988,191 people shows a weak negative correlation between the proportion of Immigrants from Syria and poverty level in the United States with a correlation coefficient (R) of -0.286 and weighted average of 12.3%. Similarly, the statistical analysis conducted on geographies consisting of 55,667,697 people shows a significant positive correlation between the proportion of Ute and poverty level in the United States with a correlation coefficient (R) of 0.600 and weighted average of 16.9%, a difference of 36.9%.
Poverty Correlation Summary
| Measurement | Immigrants from Syria | Ute |
| Minimum | 2.7% | 2.0% |
| Maximum | 20.8% | 66.0% |
| Range | 18.1% | 64.0% |
| Mean | 10.7% | 22.6% |
| Median | 10.5% | 15.9% |
| Interquartile 25% (IQ1) | 8.2% | 12.9% |
| Interquartile 75% (IQ3) | 13.4% | 32.4% |
| Interquartile Range (IQR) | 5.2% | 19.5% |
| Standard Deviation (Sample) | 4.2% | 15.0% |
| Standard Deviation (Population) | 4.1% | 14.8% |
Similar Demographics by Poverty
Demographics Similar to Immigrants from Syria by Poverty
In terms of poverty, the demographic groups most similar to Immigrants from Syria are Immigrants from Colombia (12.3%, a difference of 0.020%), South American (12.3%, a difference of 0.12%), Lebanese (12.3%, a difference of 0.25%), Celtic (12.3%, a difference of 0.26%), and Uruguayan (12.4%, a difference of 0.27%).
| Demographics | Rating | Rank | Poverty |
| Immigrants | Oceania | 54.6 /100 | #170 | Average 12.3% |
| Immigrants | Spain | 51.3 /100 | #171 | Average 12.3% |
| Immigrants | Portugal | 50.5 /100 | #172 | Average 12.3% |
| Celtics | 50.1 /100 | #173 | Average 12.3% |
| Lebanese | 50.0 /100 | #174 | Average 12.3% |
| South Americans | 48.7 /100 | #175 | Average 12.3% |
| Immigrants | Colombia | 47.7 /100 | #176 | Average 12.3% |
| Immigrants | Syria | 47.5 /100 | #177 | Average 12.3% |
| Uruguayans | 44.7 /100 | #178 | Average 12.4% |
| Immigrants | Morocco | 44.0 /100 | #179 | Average 12.4% |
| Mongolians | 43.6 /100 | #180 | Average 12.4% |
| Immigrants | Afghanistan | 42.1 /100 | #181 | Average 12.4% |
| Immigrants | Cameroon | 41.7 /100 | #182 | Average 12.4% |
| Immigrants | Iraq | 40.2 /100 | #183 | Average 12.4% |
| Kenyans | 38.8 /100 | #184 | Fair 12.5% |
Demographics Similar to Ute by Poverty
In terms of poverty, the demographic groups most similar to Ute are Kiowa (16.8%, a difference of 0.43%), Paiute (16.7%, a difference of 0.96%), Central American Indian (16.7%, a difference of 1.3%), Yakama (16.7%, a difference of 1.5%), and Colville (16.6%, a difference of 2.0%).
| Demographics | Rating | Rank | Poverty |
| Arapaho | 0.0 /100 | #321 | Tragic 16.3% |
| Menominee | 0.0 /100 | #322 | Tragic 16.4% |
| Colville | 0.0 /100 | #323 | Tragic 16.6% |
| Yakama | 0.0 /100 | #324 | Tragic 16.7% |
| Central American Indians | 0.0 /100 | #325 | Tragic 16.7% |
| Paiute | 0.0 /100 | #326 | Tragic 16.7% |
| Kiowa | 0.0 /100 | #327 | Tragic 16.8% |
| Ute | 0.0 /100 | #328 | Tragic 16.9% |
| Blacks/African Americans | 0.0 /100 | #329 | Tragic 17.3% |
| Dominicans | 0.0 /100 | #330 | Tragic 17.6% |
| Immigrants | Dominican Republic | 0.0 /100 | #331 | Tragic 17.8% |
| Natives/Alaskans | 0.0 /100 | #332 | Tragic 18.1% |
| Houma | 0.0 /100 | #333 | Tragic 18.4% |
| Apache | 0.0 /100 | #334 | Tragic 18.4% |
| Cheyenne | 0.0 /100 | #335 | Tragic 18.9% |