Luxembourger vs Trinidadian and Tobagonian Female Poverty Among 18-24 Year Olds
COMPARE
Luxembourger
Trinidadian and Tobagonian
Female Poverty Among 18-24 Year Olds
Female Poverty Among 18-24 Year Olds Comparison
Luxembourgers
Trinidadians and Tobagonians
20.9%
FEMALE POVERTY AMONG 18-24 YEAR OLDS
4.2/ 100
METRIC RATING
240th/ 347
METRIC RANK
19.8%
FEMALE POVERTY AMONG 18-24 YEAR OLDS
74.4/ 100
METRIC RATING
159th/ 347
METRIC RANK
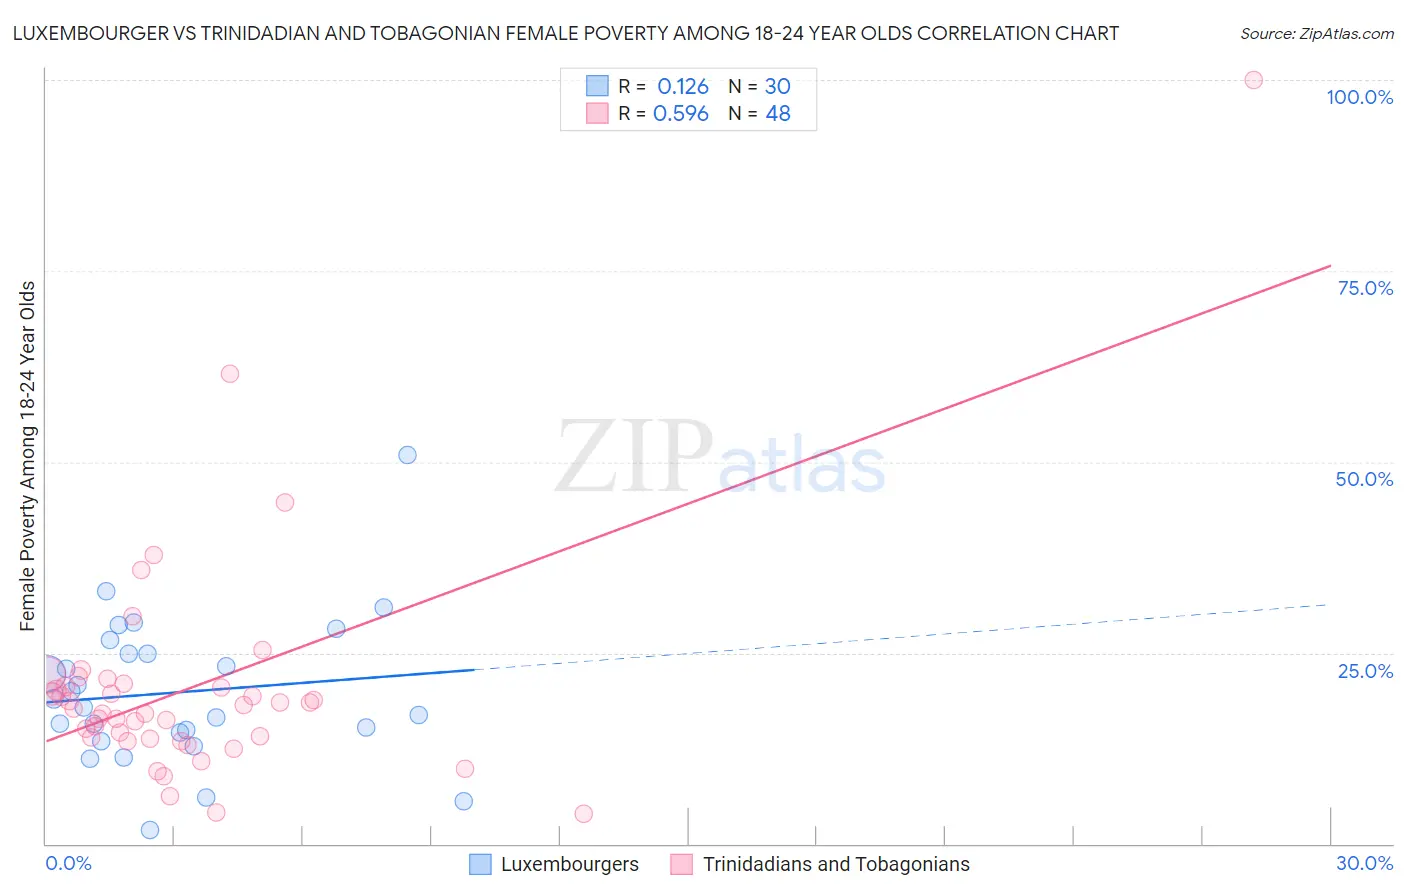
Luxembourger vs Trinidadian and Tobagonian Female Poverty Among 18-24 Year Olds Correlation Chart
The statistical analysis conducted on geographies consisting of 142,199,227 people shows a poor positive correlation between the proportion of Luxembourgers and poverty level among females between the ages 18 and 24 in the United States with a correlation coefficient (R) of 0.126 and weighted average of 20.9%. Similarly, the statistical analysis conducted on geographies consisting of 216,840,650 people shows a substantial positive correlation between the proportion of Trinidadians and Tobagonians and poverty level among females between the ages 18 and 24 in the United States with a correlation coefficient (R) of 0.596 and weighted average of 19.8%, a difference of 5.2%.
Female Poverty Among 18-24 Year Olds Correlation Summary
| Measurement | Luxembourger | Trinidadian and Tobagonian |
| Minimum | 1.9% | 3.9% |
| Maximum | 50.8% | 100.0% |
| Range | 49.0% | 96.1% |
| Mean | 19.8% | 20.5% |
| Median | 18.4% | 17.9% |
| Interquartile 25% (IQ1) | 14.5% | 13.8% |
| Interquartile 75% (IQ3) | 24.9% | 20.7% |
| Interquartile Range (IQR) | 10.5% | 6.9% |
| Standard Deviation (Sample) | 9.7% | 15.3% |
| Standard Deviation (Population) | 9.5% | 15.2% |
Similar Demographics by Female Poverty Among 18-24 Year Olds
Demographics Similar to Luxembourgers by Female Poverty Among 18-24 Year Olds
In terms of female poverty among 18-24 year olds, the demographic groups most similar to Luxembourgers are Immigrants from Eritrea (20.9%, a difference of 0.020%), Immigrants from Guatemala (20.9%, a difference of 0.030%), Israeli (20.9%, a difference of 0.030%), Immigrants from Singapore (20.9%, a difference of 0.040%), and Scottish (20.9%, a difference of 0.070%).
| Demographics | Rating | Rank | Female Poverty Among 18-24 Year Olds |
| Immigrants | Denmark | 5.8 /100 | #233 | Tragic 20.8% |
| Welsh | 5.4 /100 | #234 | Tragic 20.8% |
| Immigrants | Uganda | 5.1 /100 | #235 | Tragic 20.8% |
| Okinawans | 4.9 /100 | #236 | Tragic 20.8% |
| Scottish | 4.5 /100 | #237 | Tragic 20.9% |
| Immigrants | Singapore | 4.4 /100 | #238 | Tragic 20.9% |
| Immigrants | Guatemala | 4.3 /100 | #239 | Tragic 20.9% |
| Luxembourgers | 4.2 /100 | #240 | Tragic 20.9% |
| Immigrants | Eritrea | 4.2 /100 | #241 | Tragic 20.9% |
| Israelis | 4.1 /100 | #242 | Tragic 20.9% |
| Marshallese | 3.4 /100 | #243 | Tragic 20.9% |
| Immigrants | Thailand | 3.4 /100 | #244 | Tragic 20.9% |
| Aleuts | 3.3 /100 | #245 | Tragic 20.9% |
| Immigrants | Australia | 3.1 /100 | #246 | Tragic 20.9% |
| Immigrants | Africa | 3.0 /100 | #247 | Tragic 21.0% |
Demographics Similar to Trinidadians and Tobagonians by Female Poverty Among 18-24 Year Olds
In terms of female poverty among 18-24 year olds, the demographic groups most similar to Trinidadians and Tobagonians are Pakistani (19.8%, a difference of 0.020%), Immigrants from Belize (19.8%, a difference of 0.020%), Immigrants from Lebanon (19.8%, a difference of 0.060%), Danish (19.8%, a difference of 0.070%), and French Canadian (19.9%, a difference of 0.090%).
| Demographics | Rating | Rank | Female Poverty Among 18-24 Year Olds |
| Yugoslavians | 79.0 /100 | #152 | Good 19.8% |
| Immigrants | Japan | 78.1 /100 | #153 | Good 19.8% |
| Immigrants | Zimbabwe | 76.7 /100 | #154 | Good 19.8% |
| Hungarians | 76.6 /100 | #155 | Good 19.8% |
| Immigrants | Belgium | 76.4 /100 | #156 | Good 19.8% |
| Danes | 75.5 /100 | #157 | Good 19.8% |
| Immigrants | Lebanon | 75.3 /100 | #158 | Good 19.8% |
| Trinidadians and Tobagonians | 74.4 /100 | #159 | Good 19.8% |
| Pakistanis | 74.1 /100 | #160 | Good 19.8% |
| Immigrants | Belize | 74.1 /100 | #161 | Good 19.8% |
| French Canadians | 73.0 /100 | #162 | Good 19.9% |
| Malaysians | 72.7 /100 | #163 | Good 19.9% |
| Central Americans | 70.0 /100 | #164 | Good 19.9% |
| Eastern Europeans | 69.3 /100 | #165 | Good 19.9% |
| Belgians | 69.1 /100 | #166 | Good 19.9% |