Lithuanian vs Immigrants from Moldova Receiving Food Stamps
COMPARE
Lithuanian
Immigrants from Moldova
Receiving Food Stamps
Receiving Food Stamps Comparison
Lithuanians
Immigrants from Moldova
9.7%
RECEIVING FOOD STAMPS
99.4/ 100
METRIC RATING
50th/ 347
METRIC RANK
10.9%
RECEIVING FOOD STAMPS
88.5/ 100
METRIC RATING
138th/ 347
METRIC RANK
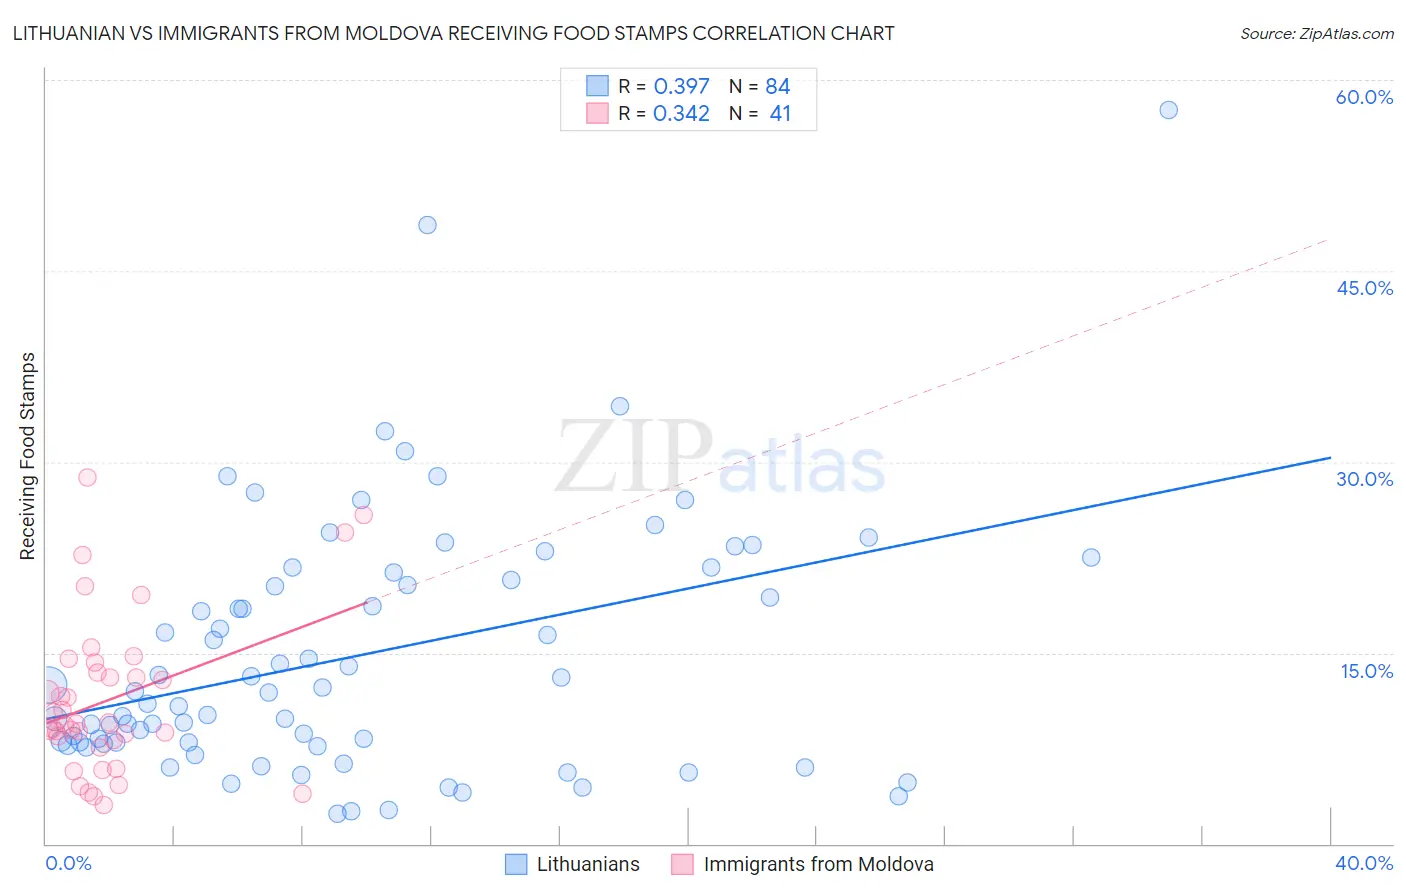
Lithuanian vs Immigrants from Moldova Receiving Food Stamps Correlation Chart
The statistical analysis conducted on geographies consisting of 420,339,892 people shows a mild positive correlation between the proportion of Lithuanians and percentage of population receiving government assistance and/or food stamps in the United States with a correlation coefficient (R) of 0.397 and weighted average of 9.7%. Similarly, the statistical analysis conducted on geographies consisting of 124,289,346 people shows a mild positive correlation between the proportion of Immigrants from Moldova and percentage of population receiving government assistance and/or food stamps in the United States with a correlation coefficient (R) of 0.342 and weighted average of 10.9%, a difference of 12.8%.
Receiving Food Stamps Correlation Summary
| Measurement | Lithuanian | Immigrants from Moldova |
| Minimum | 2.4% | 3.0% |
| Maximum | 57.6% | 28.7% |
| Range | 55.2% | 25.7% |
| Mean | 14.8% | 11.3% |
| Median | 11.9% | 9.4% |
| Interquartile 25% (IQ1) | 7.9% | 7.9% |
| Interquartile 75% (IQ3) | 21.0% | 13.8% |
| Interquartile Range (IQR) | 13.1% | 5.9% |
| Standard Deviation (Sample) | 10.0% | 6.2% |
| Standard Deviation (Population) | 10.0% | 6.1% |
Similar Demographics by Receiving Food Stamps
Demographics Similar to Lithuanians by Receiving Food Stamps
In terms of receiving food stamps, the demographic groups most similar to Lithuanians are Asian (9.7%, a difference of 0.18%), Immigrants from South Africa (9.7%, a difference of 0.19%), Tongan (9.7%, a difference of 0.21%), Immigrants from Czechoslovakia (9.6%, a difference of 0.25%), and Russian (9.6%, a difference of 0.27%).
| Demographics | Rating | Rank | Receiving Food Stamps |
| Croatians | 99.5 /100 | #43 | Exceptional 9.6% |
| Immigrants | Denmark | 99.4 /100 | #44 | Exceptional 9.6% |
| Immigrants | Belgium | 99.4 /100 | #45 | Exceptional 9.6% |
| Australians | 99.4 /100 | #46 | Exceptional 9.6% |
| Indians (Asian) | 99.4 /100 | #47 | Exceptional 9.6% |
| Russians | 99.4 /100 | #48 | Exceptional 9.6% |
| Immigrants | Czechoslovakia | 99.4 /100 | #49 | Exceptional 9.6% |
| Lithuanians | 99.4 /100 | #50 | Exceptional 9.7% |
| Asians | 99.3 /100 | #51 | Exceptional 9.7% |
| Immigrants | South Africa | 99.3 /100 | #52 | Exceptional 9.7% |
| Tongans | 99.3 /100 | #53 | Exceptional 9.7% |
| Swiss | 99.3 /100 | #54 | Exceptional 9.7% |
| Immigrants | Switzerland | 99.3 /100 | #55 | Exceptional 9.7% |
| Immigrants | Canada | 99.3 /100 | #56 | Exceptional 9.7% |
| Greeks | 99.3 /100 | #57 | Exceptional 9.7% |
Demographics Similar to Immigrants from Moldova by Receiving Food Stamps
In terms of receiving food stamps, the demographic groups most similar to Immigrants from Moldova are Hmong (10.9%, a difference of 0.040%), Celtic (10.9%, a difference of 0.24%), Immigrants from Eastern Europe (10.8%, a difference of 0.51%), Slovak (10.8%, a difference of 0.53%), and Immigrants from Vietnam (11.0%, a difference of 0.61%).
| Demographics | Rating | Rank | Receiving Food Stamps |
| French | 92.3 /100 | #131 | Exceptional 10.7% |
| Immigrants | Germany | 92.0 /100 | #132 | Exceptional 10.7% |
| Immigrants | Russia | 90.9 /100 | #133 | Exceptional 10.8% |
| Immigrants | Brazil | 90.3 /100 | #134 | Exceptional 10.8% |
| Argentineans | 90.2 /100 | #135 | Exceptional 10.8% |
| Slovaks | 89.8 /100 | #136 | Excellent 10.8% |
| Immigrants | Eastern Europe | 89.8 /100 | #137 | Excellent 10.8% |
| Immigrants | Moldova | 88.5 /100 | #138 | Excellent 10.9% |
| Hmong | 88.4 /100 | #139 | Excellent 10.9% |
| Celtics | 87.8 /100 | #140 | Excellent 10.9% |
| Immigrants | Vietnam | 86.7 /100 | #141 | Excellent 11.0% |
| Chileans | 86.2 /100 | #142 | Excellent 11.0% |
| Immigrants | Northern Africa | 86.0 /100 | #143 | Excellent 11.0% |
| Syrians | 85.5 /100 | #144 | Excellent 11.0% |
| Hungarians | 85.1 /100 | #145 | Excellent 11.0% |