Lithuanian vs Ute Receiving Food Stamps
COMPARE
Lithuanian
Ute
Receiving Food Stamps
Receiving Food Stamps Comparison
Lithuanians
Ute
9.7%
RECEIVING FOOD STAMPS
99.4/ 100
METRIC RATING
50th/ 347
METRIC RANK
14.7%
RECEIVING FOOD STAMPS
0.1/ 100
METRIC RATING
275th/ 347
METRIC RANK
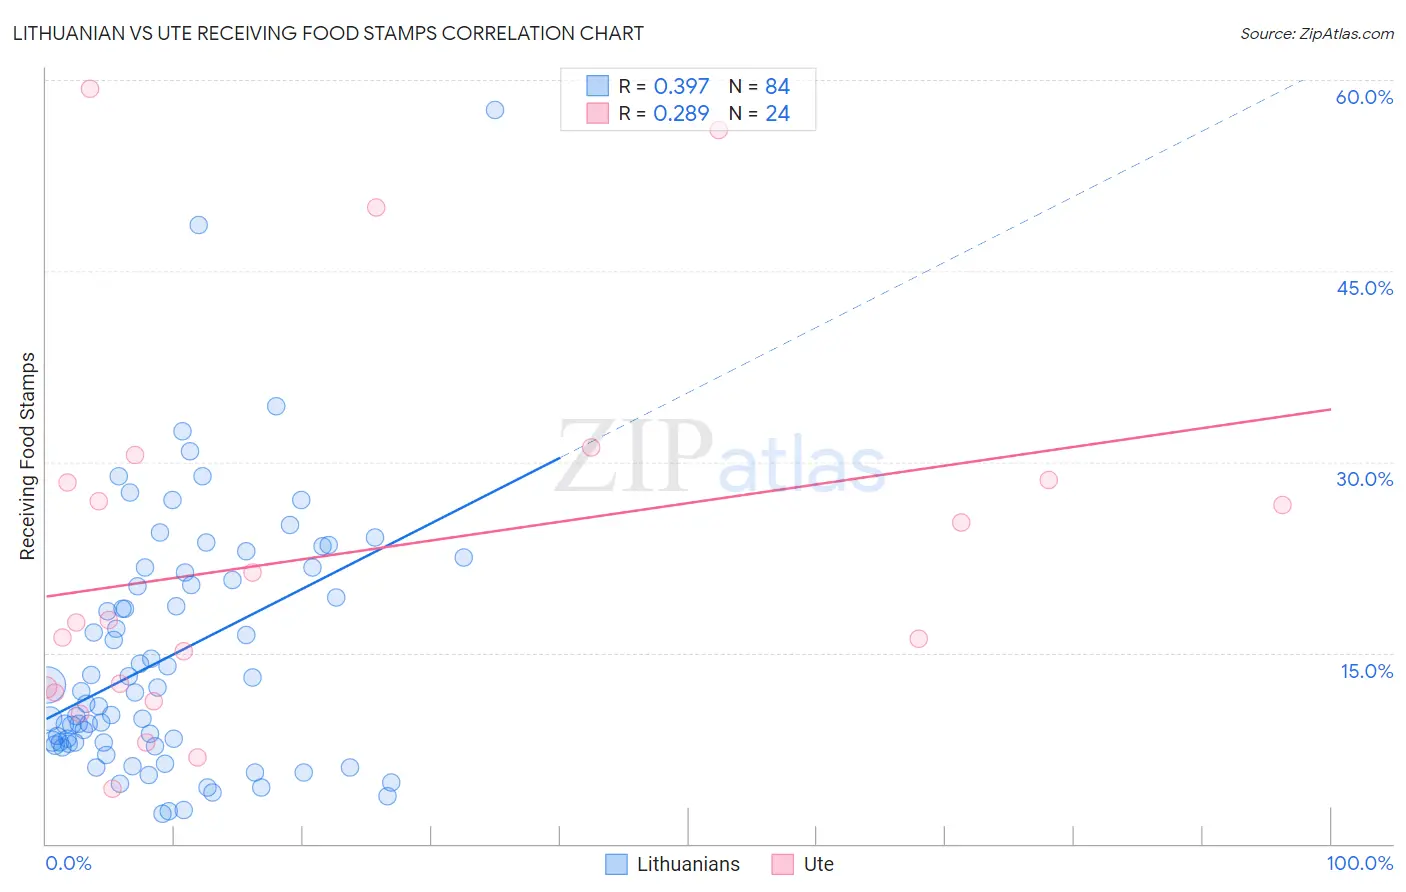
Lithuanian vs Ute Receiving Food Stamps Correlation Chart
The statistical analysis conducted on geographies consisting of 420,339,892 people shows a mild positive correlation between the proportion of Lithuanians and percentage of population receiving government assistance and/or food stamps in the United States with a correlation coefficient (R) of 0.397 and weighted average of 9.7%. Similarly, the statistical analysis conducted on geographies consisting of 55,636,581 people shows a weak positive correlation between the proportion of Ute and percentage of population receiving government assistance and/or food stamps in the United States with a correlation coefficient (R) of 0.289 and weighted average of 14.7%, a difference of 52.1%.
Receiving Food Stamps Correlation Summary
| Measurement | Lithuanian | Ute |
| Minimum | 2.4% | 4.3% |
| Maximum | 57.6% | 59.3% |
| Range | 55.2% | 55.0% |
| Mean | 14.8% | 22.6% |
| Median | 11.9% | 17.4% |
| Interquartile 25% (IQ1) | 7.9% | 12.1% |
| Interquartile 75% (IQ3) | 21.0% | 28.5% |
| Interquartile Range (IQR) | 13.1% | 16.4% |
| Standard Deviation (Sample) | 10.0% | 14.8% |
| Standard Deviation (Population) | 10.0% | 14.5% |
Similar Demographics by Receiving Food Stamps
Demographics Similar to Lithuanians by Receiving Food Stamps
In terms of receiving food stamps, the demographic groups most similar to Lithuanians are Asian (9.7%, a difference of 0.18%), Immigrants from South Africa (9.7%, a difference of 0.19%), Tongan (9.7%, a difference of 0.21%), Immigrants from Czechoslovakia (9.6%, a difference of 0.25%), and Russian (9.6%, a difference of 0.27%).
| Demographics | Rating | Rank | Receiving Food Stamps |
| Croatians | 99.5 /100 | #43 | Exceptional 9.6% |
| Immigrants | Denmark | 99.4 /100 | #44 | Exceptional 9.6% |
| Immigrants | Belgium | 99.4 /100 | #45 | Exceptional 9.6% |
| Australians | 99.4 /100 | #46 | Exceptional 9.6% |
| Indians (Asian) | 99.4 /100 | #47 | Exceptional 9.6% |
| Russians | 99.4 /100 | #48 | Exceptional 9.6% |
| Immigrants | Czechoslovakia | 99.4 /100 | #49 | Exceptional 9.6% |
| Lithuanians | 99.4 /100 | #50 | Exceptional 9.7% |
| Asians | 99.3 /100 | #51 | Exceptional 9.7% |
| Immigrants | South Africa | 99.3 /100 | #52 | Exceptional 9.7% |
| Tongans | 99.3 /100 | #53 | Exceptional 9.7% |
| Swiss | 99.3 /100 | #54 | Exceptional 9.7% |
| Immigrants | Switzerland | 99.3 /100 | #55 | Exceptional 9.7% |
| Immigrants | Canada | 99.3 /100 | #56 | Exceptional 9.7% |
| Greeks | 99.3 /100 | #57 | Exceptional 9.7% |
Demographics Similar to Ute by Receiving Food Stamps
In terms of receiving food stamps, the demographic groups most similar to Ute are Immigrants from Western Africa (14.7%, a difference of 0.080%), Alaskan Athabascan (14.7%, a difference of 0.10%), Chippewa (14.7%, a difference of 0.13%), Immigrants from Guatemala (14.6%, a difference of 0.35%), and Mexican (14.6%, a difference of 0.44%).
| Demographics | Rating | Rank | Receiving Food Stamps |
| Guatemalans | 0.1 /100 | #268 | Tragic 14.4% |
| Nepalese | 0.1 /100 | #269 | Tragic 14.6% |
| Mexicans | 0.1 /100 | #270 | Tragic 14.6% |
| Immigrants | Guatemala | 0.1 /100 | #271 | Tragic 14.6% |
| Chippewa | 0.1 /100 | #272 | Tragic 14.7% |
| Alaskan Athabascans | 0.1 /100 | #273 | Tragic 14.7% |
| Immigrants | Western Africa | 0.1 /100 | #274 | Tragic 14.7% |
| Ute | 0.1 /100 | #275 | Tragic 14.7% |
| Liberians | 0.1 /100 | #276 | Tragic 14.8% |
| Seminole | 0.1 /100 | #277 | Tragic 14.8% |
| Belizeans | 0.1 /100 | #278 | Tragic 14.8% |
| Kiowa | 0.0 /100 | #279 | Tragic 14.9% |
| Ecuadorians | 0.0 /100 | #280 | Tragic 14.9% |
| Spanish American Indians | 0.0 /100 | #281 | Tragic 14.9% |
| Immigrants | Central America | 0.0 /100 | #282 | Tragic 15.0% |