Korean vs Cape Verdean Poverty
COMPARE
Korean
Cape Verdean
Poverty
Poverty Comparison
Koreans
Cape Verdeans
10.9%
POVERTY
99.2/ 100
METRIC RATING
42nd/ 347
METRIC RANK
14.4%
POVERTY
0.1/ 100
METRIC RATING
260th/ 347
METRIC RANK
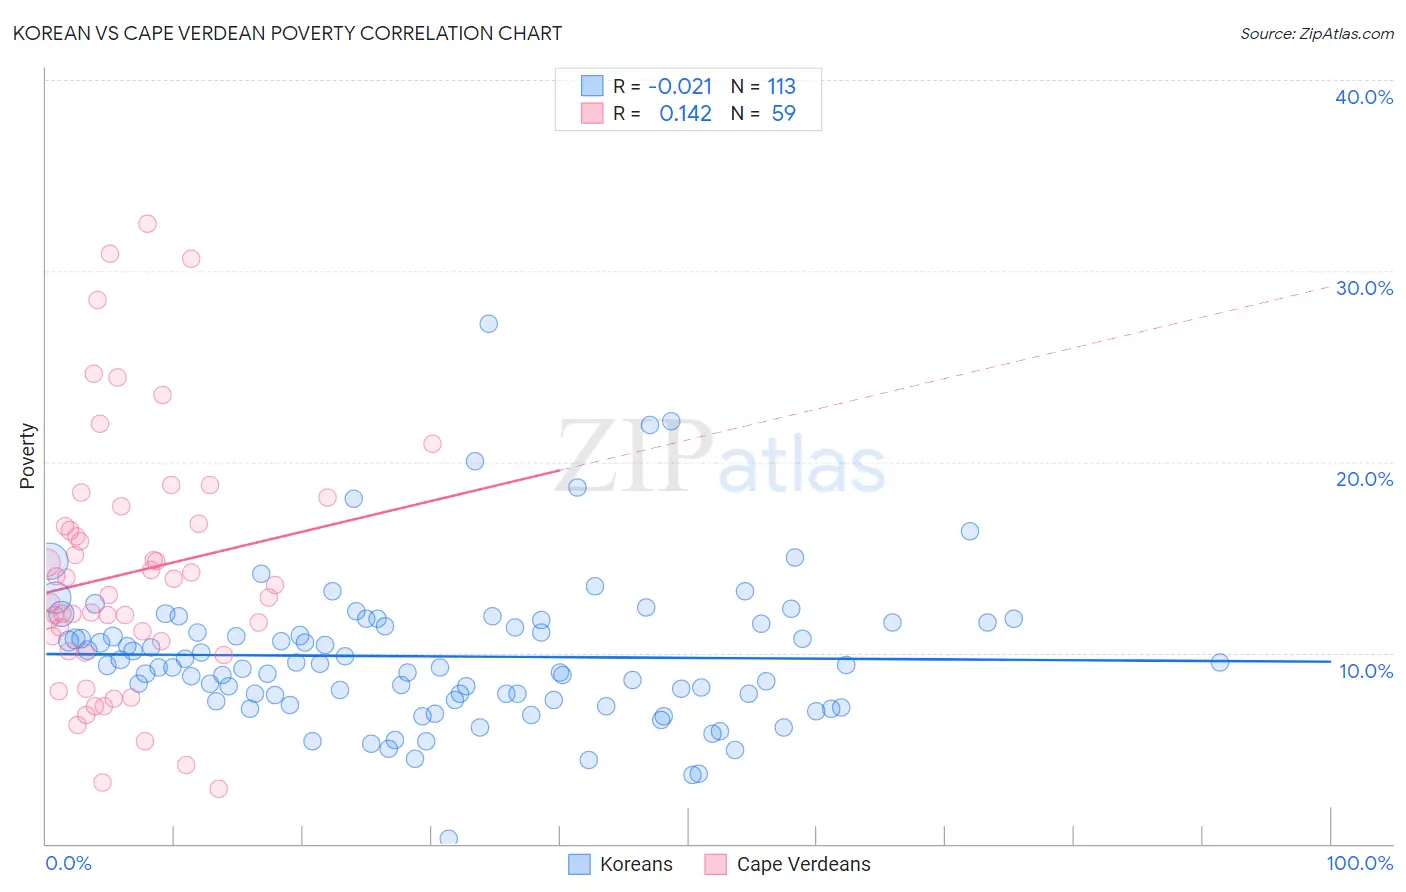
Korean vs Cape Verdean Poverty Correlation Chart
The statistical analysis conducted on geographies consisting of 510,388,718 people shows no correlation between the proportion of Koreans and poverty level in the United States with a correlation coefficient (R) of -0.021 and weighted average of 10.9%. Similarly, the statistical analysis conducted on geographies consisting of 107,560,730 people shows a poor positive correlation between the proportion of Cape Verdeans and poverty level in the United States with a correlation coefficient (R) of 0.142 and weighted average of 14.4%, a difference of 31.8%.
Poverty Correlation Summary
| Measurement | Korean | Cape Verdean |
| Minimum | 0.27% | 2.9% |
| Maximum | 27.2% | 32.5% |
| Range | 27.0% | 29.6% |
| Mean | 9.8% | 14.2% |
| Median | 9.3% | 13.0% |
| Interquartile 25% (IQ1) | 7.5% | 10.1% |
| Interquartile 75% (IQ3) | 11.6% | 16.7% |
| Interquartile Range (IQR) | 4.0% | 6.6% |
| Standard Deviation (Sample) | 3.9% | 6.6% |
| Standard Deviation (Population) | 3.8% | 6.6% |
Similar Demographics by Poverty
Demographics Similar to Koreans by Poverty
In terms of poverty, the demographic groups most similar to Koreans are Immigrants from Singapore (10.9%, a difference of 0.050%), Immigrants from Moldova (10.9%, a difference of 0.19%), Immigrants from Iran (10.9%, a difference of 0.22%), Russian (10.9%, a difference of 0.31%), and Immigrants from Pakistan (10.8%, a difference of 0.36%).
| Demographics | Rating | Rank | Poverty |
| Tongans | 99.4 /100 | #35 | Exceptional 10.8% |
| Cypriots | 99.3 /100 | #36 | Exceptional 10.8% |
| Immigrants | Greece | 99.3 /100 | #37 | Exceptional 10.8% |
| Czechs | 99.3 /100 | #38 | Exceptional 10.8% |
| Immigrants | Pakistan | 99.3 /100 | #39 | Exceptional 10.8% |
| Russians | 99.3 /100 | #40 | Exceptional 10.9% |
| Immigrants | Iran | 99.2 /100 | #41 | Exceptional 10.9% |
| Koreans | 99.2 /100 | #42 | Exceptional 10.9% |
| Immigrants | Singapore | 99.2 /100 | #43 | Exceptional 10.9% |
| Immigrants | Moldova | 99.1 /100 | #44 | Exceptional 10.9% |
| Turks | 98.9 /100 | #45 | Exceptional 11.0% |
| Immigrants | Czechoslovakia | 98.9 /100 | #46 | Exceptional 11.0% |
| Immigrants | Romania | 98.9 /100 | #47 | Exceptional 11.0% |
| Slovenes | 98.9 /100 | #48 | Exceptional 11.0% |
| Immigrants | Japan | 98.9 /100 | #49 | Exceptional 11.0% |
Demographics Similar to Cape Verdeans by Poverty
In terms of poverty, the demographic groups most similar to Cape Verdeans are Cherokee (14.4%, a difference of 0.020%), Immigrants from Nicaragua (14.3%, a difference of 0.080%), Immigrants from Liberia (14.4%, a difference of 0.18%), Ottawa (14.3%, a difference of 0.35%), and Trinidadian and Tobagonian (14.3%, a difference of 0.36%).
| Demographics | Rating | Rank | Poverty |
| Immigrants | Trinidad and Tobago | 0.2 /100 | #253 | Tragic 14.2% |
| Immigrants | El Salvador | 0.1 /100 | #254 | Tragic 14.3% |
| Immigrants | Ecuador | 0.1 /100 | #255 | Tragic 14.3% |
| Mexican American Indians | 0.1 /100 | #256 | Tragic 14.3% |
| Trinidadians and Tobagonians | 0.1 /100 | #257 | Tragic 14.3% |
| Ottawa | 0.1 /100 | #258 | Tragic 14.3% |
| Immigrants | Nicaragua | 0.1 /100 | #259 | Tragic 14.3% |
| Cape Verdeans | 0.1 /100 | #260 | Tragic 14.4% |
| Cherokee | 0.1 /100 | #261 | Tragic 14.4% |
| Immigrants | Liberia | 0.1 /100 | #262 | Tragic 14.4% |
| Jamaicans | 0.1 /100 | #263 | Tragic 14.4% |
| Immigrants | Jamaica | 0.1 /100 | #264 | Tragic 14.4% |
| Immigrants | Guyana | 0.1 /100 | #265 | Tragic 14.5% |
| Guyanese | 0.1 /100 | #266 | Tragic 14.5% |
| Iroquois | 0.1 /100 | #267 | Tragic 14.5% |